 Korea Immigration Regional Dashboard
English
Immigrant statistics for Korea
This dashboard is for immigrants living in Korea and for the practitioners and researchers who work with them. It compiles the statistics that the Ministry of Justice and the Ministry of the Interior and Safety publish each year for Korea's 250 districts, shows the number of registered foreigners and their nationalities, visa statuses and languages by year, and lists the organizations that help immigrants on a map and in a directory.
Frequently askedWhat share of Ansan Danwon-gu is foreign?Where do Vietnamese residents live?Where can I take Korean classes in Suwon?Which districts have the most registered foreigners?
Highest shares
Support organizations and guides
Organizations and programs that help immigrants can be found by area and by the kind of help needed.
Help needed
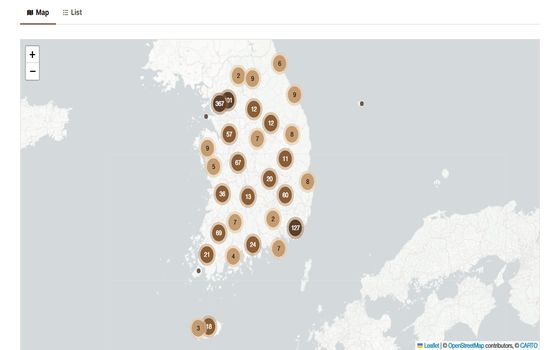 Service mapThe map and the list show support organizations and can be narrowed by area, type and the help needed.
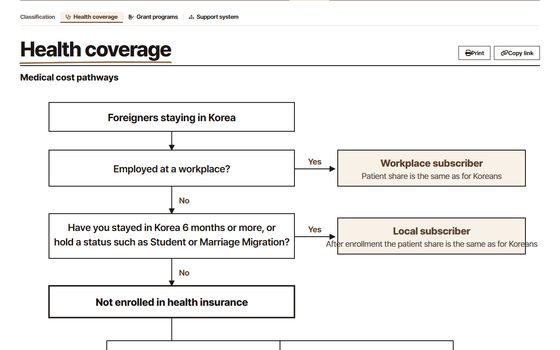 Health coverageStep by step, the guide covers health insurance enrollment, medical support programs and emergency care for each residence situation.
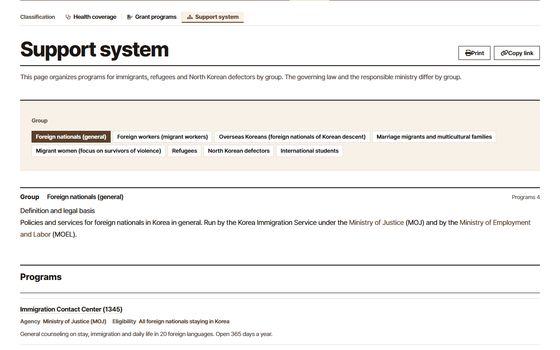 Support systemThe page organizes the programs for immigrants, refugees and North Korean defectors by group.
Statistics and maps
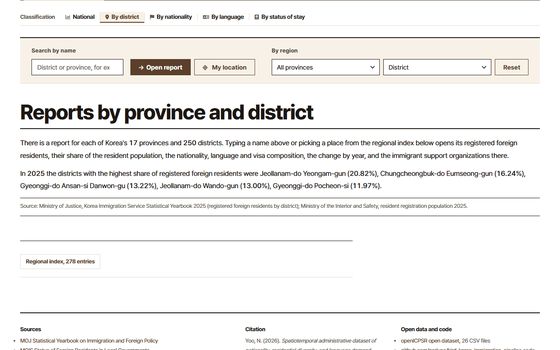 Regional reportsEach of the 17 provinces and 250 districts has a report with the number and share of registered foreigners, the mix of nationalities, languages and visa statuses, and the change by year.
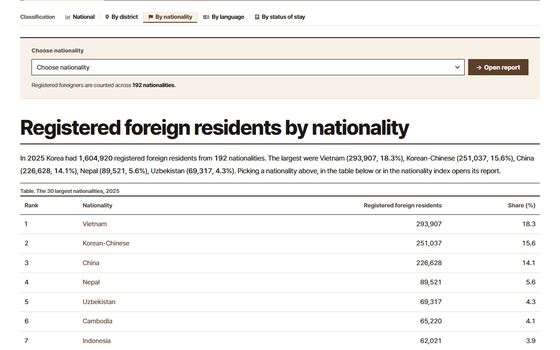 By nationalityEach nationality has its registered count, where its members live, the change over ten years and residential segregation indices.
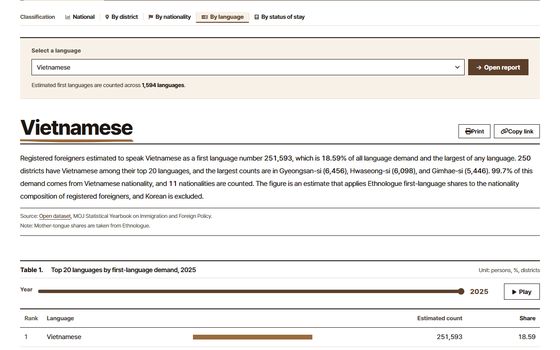 By languageThe page estimates the number of people for each mother tongue and their distribution across provinces, and explains the estimation method.
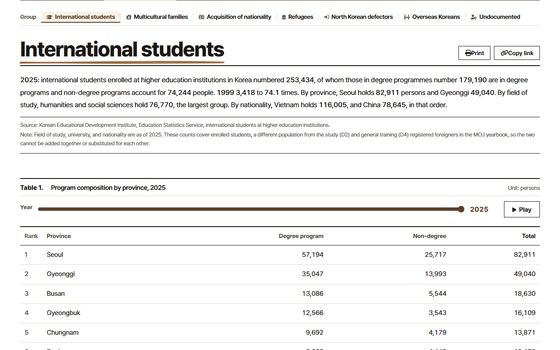 Population groupsSeparate pages cover international students, multicultural families and children, naturalization, refugees, North Korean defectors, overseas Koreans and undocumented residents.
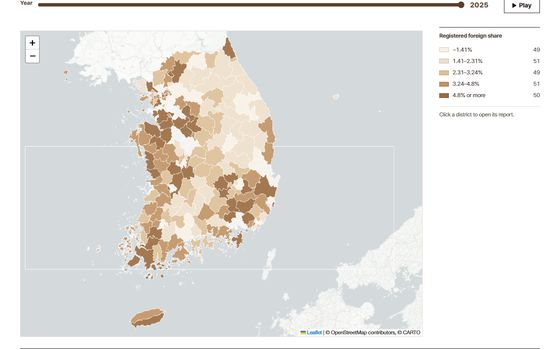 National mapThe national map shows the share by district, district types and foreign residents by neighborhood in the capital area.
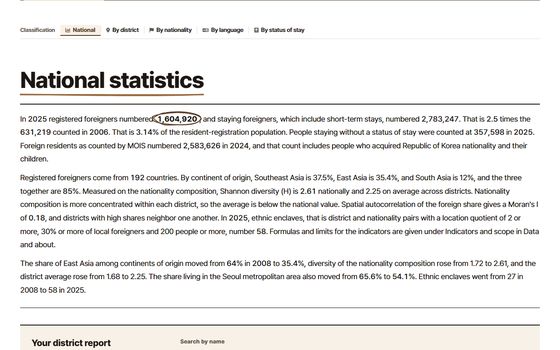 National statisticsOne page brings together the yearly trends in registered and resident foreigners, the mix of nationalities, continents and visa families, and the diversity and enclave indicators.
Spotlight reports
There are 20 nationality reports and 17 province reports. Each can be read on the web or downloaded as a PDF.
By nationality
By province
Frequently requested statistics
About the data
Registered foreigners
Registered foreigners by district, split by nationality and visa status, come each year from the MOJ Statistical Yearbook on Immigration and Foreign Policy, and the changing district boundaries are linked into one series.
Indicators and scopeForeign residents and population
The Ministry of the Interior and Safety's count of foreign residents in local governments adds naturalized citizens and their children, and resident registration statistics supply the denominator of each share.
AboutSupport organization list
Organizations that help immigrants were gathered from 65 lists and deduplicated by name, address and phone number. Websites and social media accounts are included only when confirmed as the organization's own. The list is not an official government statistic.
Service mapOpen data
The 26 files behind every chart on the site are on openICPSR, and the code that builds them is on GitHub.
doi:10.3886/E249944