 Korea Immigration Regional Dashboard
SpotlightSeptember 2026Nationality profilesDownload PDF
Korean-Chinese Immigrants in South Korea
Highlights
- About 643,300 Korean-Chinese lived in South Korea at the end of 2024, the second-largest nationality among registered foreigners (16.6 percent) and the largest among all resident foreigners (24.3 percent).
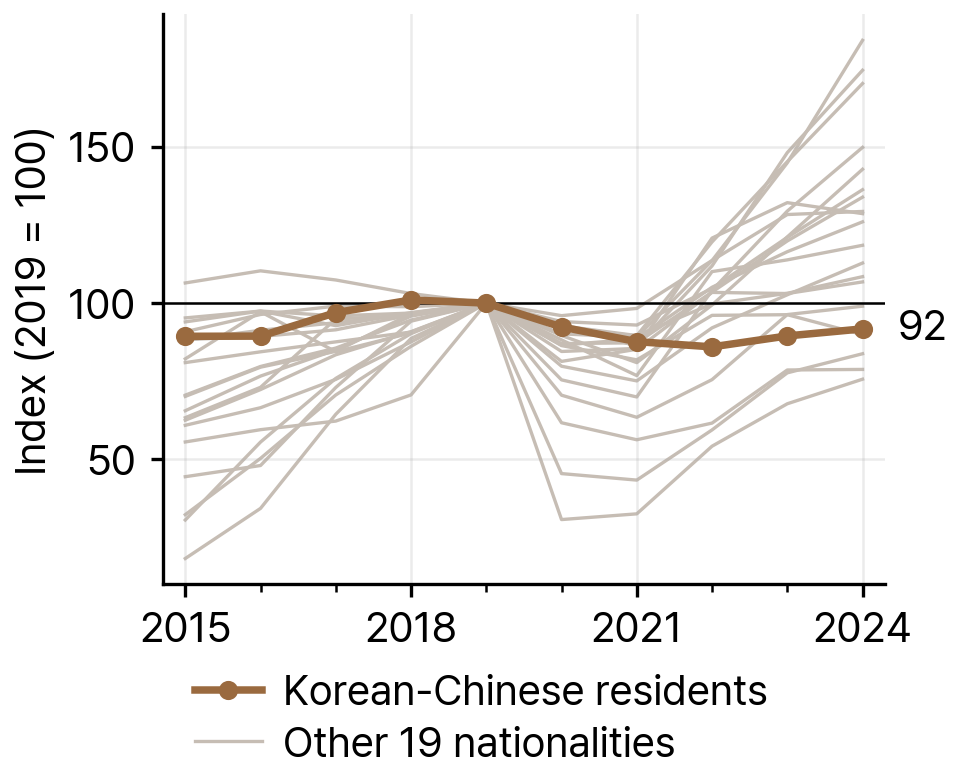
- The population peaked at 708,082 in 2018, and in 2024 it stood at 91.8 percent of its 2019 size, 16th of the 20 largest nationalities for growth over 2019-24.
- In 2024, 34.9 percent of Korean-Chinese residents were age 60 or older, compared with 12.9 percent of all resident foreigners.
At the end of 2024, 643,277 Korean-Chinese resided in South Korea. They were the second-largest nationality among registered foreigners, with 246,988 people or 16.6 percent, and the largest among all resident foreigners, at 24.3 percent. The two ranks differ because holders of the F-4 (Overseas Korean) visa report their residence instead of registering. Korean-Chinese had ranked first on both bases in 2006, 2014, and 2019. The Ministry of Justice counts ethnic Koreans of Chinese nationality (known in Korean as Joseonjok) separately from other Chinese nationals.
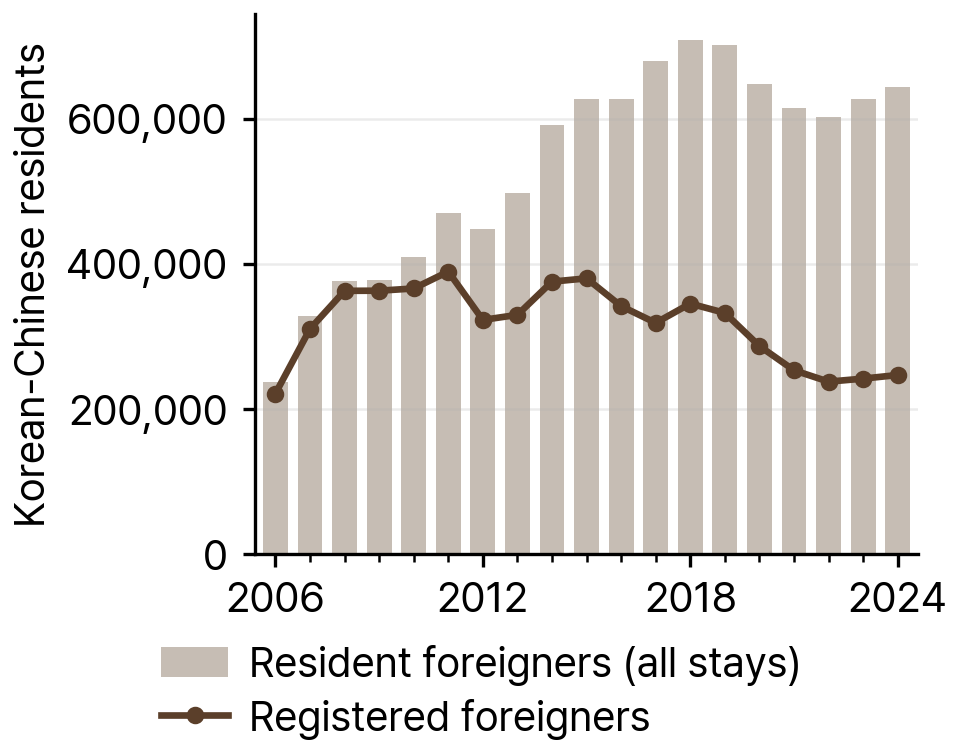
Most Korean-Chinese come on visas reserved for overseas Koreans. The H-2 Working-Visit visa is limited to foreign nationals of Korean ethnicity living in China or the former Soviet Union, a track separate from the general Employment Permit System (E-9) (HRD Korea 2026). The population grew 2.5-fold between 2006 (236,854) and 2014 (590,856), peaked at 708,082 in 2018, fell to 602,907 in 2022, and rose to 643,277 in 2024. Between 2019 and 2024 the number of H-2 holders fell from 194,792 to 79,821, while F-4 (Overseas Korean) holders rose from 346,539 to 390,862. In February 2026 the Ministry of Justice merged H-2 into F-4 (Ministry of Justice 2026).
Compared with all resident foreigners in 2024, Korean-Chinese were older (34.9 percent age 60 or older, against 12.9 percent) and more concentrated in Seoul, Incheon, and Gyeonggi (84.3 percent of registered residents, against 55.2 percent). Almost all held overseas-Korean or permanent-residence visas. Only 0.1 percent held an employment visa, compared with 19.2 percent of all resident foreigners.
Size of the Population over Time
The Korean-Chinese population grew from 236,854 in 2006 to 409,079 in 2010 and 590,856 in 2014, a 2.5-fold increase over eight years. It was 701,098 in 2019, one year after its peak of 708,082 in 2018. The count then fell each year to 602,907 in 2022 before rising to 627,450 in 2023 and 643,277 in 2024.
Source: KIRD dataset, from Ministry of Justice immigration yearbooks, 2006-2024.
With 2019 set at 100, the population index stood at 91.8 in 2024, a decline of 57,821 people (701,098 minus 643,277). That change ranked 16th among the 20 largest nationality groups. Korean-Chinese were the largest nationality among all resident foreigners in 2006, 2014, 2019, and 2024. Their share of all resident foreigners was 26.0 percent in 2006, 32.9 percent in 2014, 27.8 percent in 2019, and 24.3 percent in 2024.
Source: KIRD dataset, from Ministry of Justice immigration yearbooks, 2006-2024.
The registered count followed a different path. In 2006, 221,525 Korean-Chinese were registered, 93.5 percent of all Korean-Chinese residents (221,525 of 236,854). In 2024 the registered count was 246,988, or 38.4 percent. F-4 holders report residence instead of registering and so fall outside the registered count, and the number of Korean-Chinese F-4 holders rose from 208,312 in 2014 to 390,862 in 2024. Among registered foreigners, Korean-Chinese ranked first in 2006, 2014, and 2019 and second in 2024, and their share of all registered foreigners fell from 34.4 percent in 2014 to 16.6 percent in 2024.
Table 1Korean-Chinese Resident and Registered Foreigners in South Korea, Selected Years
| Year | Resident foreigners | Registered foreigners | Rank, resident foreigners | Rank, registered foreigners | Share of all resident foreigners (%) | Share of all registered foreigners (%) |
|---|---|---|---|---|---|---|
| 2006 | 236,854 | 221,525 | 1 | 1 | 26.0 | 35.1 |
| 2014 | 590,856 | 375,572 | 1 | 1 | 32.9 | 34.4 |
| 2019 | 701,098 | 332,525 | 1 | 1 | 27.8 | 26.1 |
| 2024 | 643,277 | 246,988 | 1 | 2 | 24.3 | 16.6 |
Note: Counts are as of 31 December. Ranks are among all nationalities, with Korean-Chinese counted separately from other Chinese nationals. Resident foreigners include F-4 holders, who report residence instead of registering.
Source: KIRD dataset, from Ministry of Justice immigration yearbooks, 2006-2024.
Distribution by Province and District
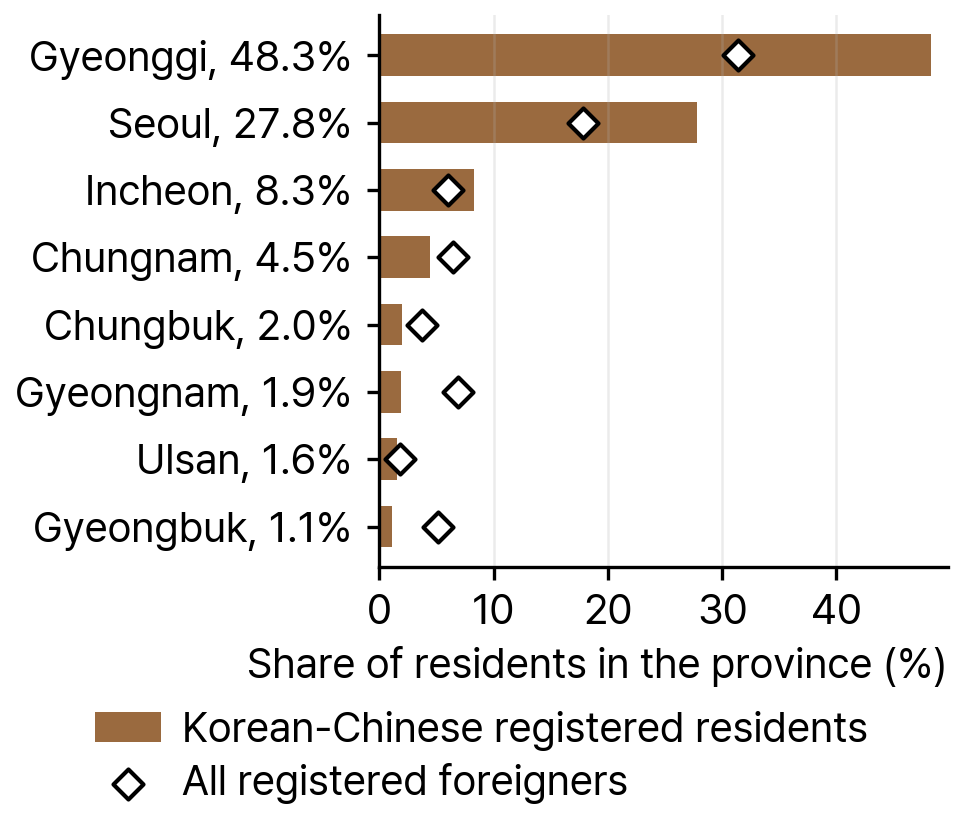
District data cover registered foreigners only (246,988 Korean-Chinese in 2024). Of these, 56.5 percent (139,635) lived in Incheon and Gyeonggi and 27.8 percent (68,560) in Seoul. Together the capital region was home to 84.3 percent of registered Korean-Chinese, compared with 55.2 percent of all registered foreigners. Chungcheong accounted for 7.1 percent (17,612), Yeongnam 5.9 percent (14,608), Honam 1.6 percent (4,058), and Gangwon and Jeju 1.0 percent (2,515).
Source: KIRD dataset, from Ministry of Justice registered-foreigner statistics by district, 2024.
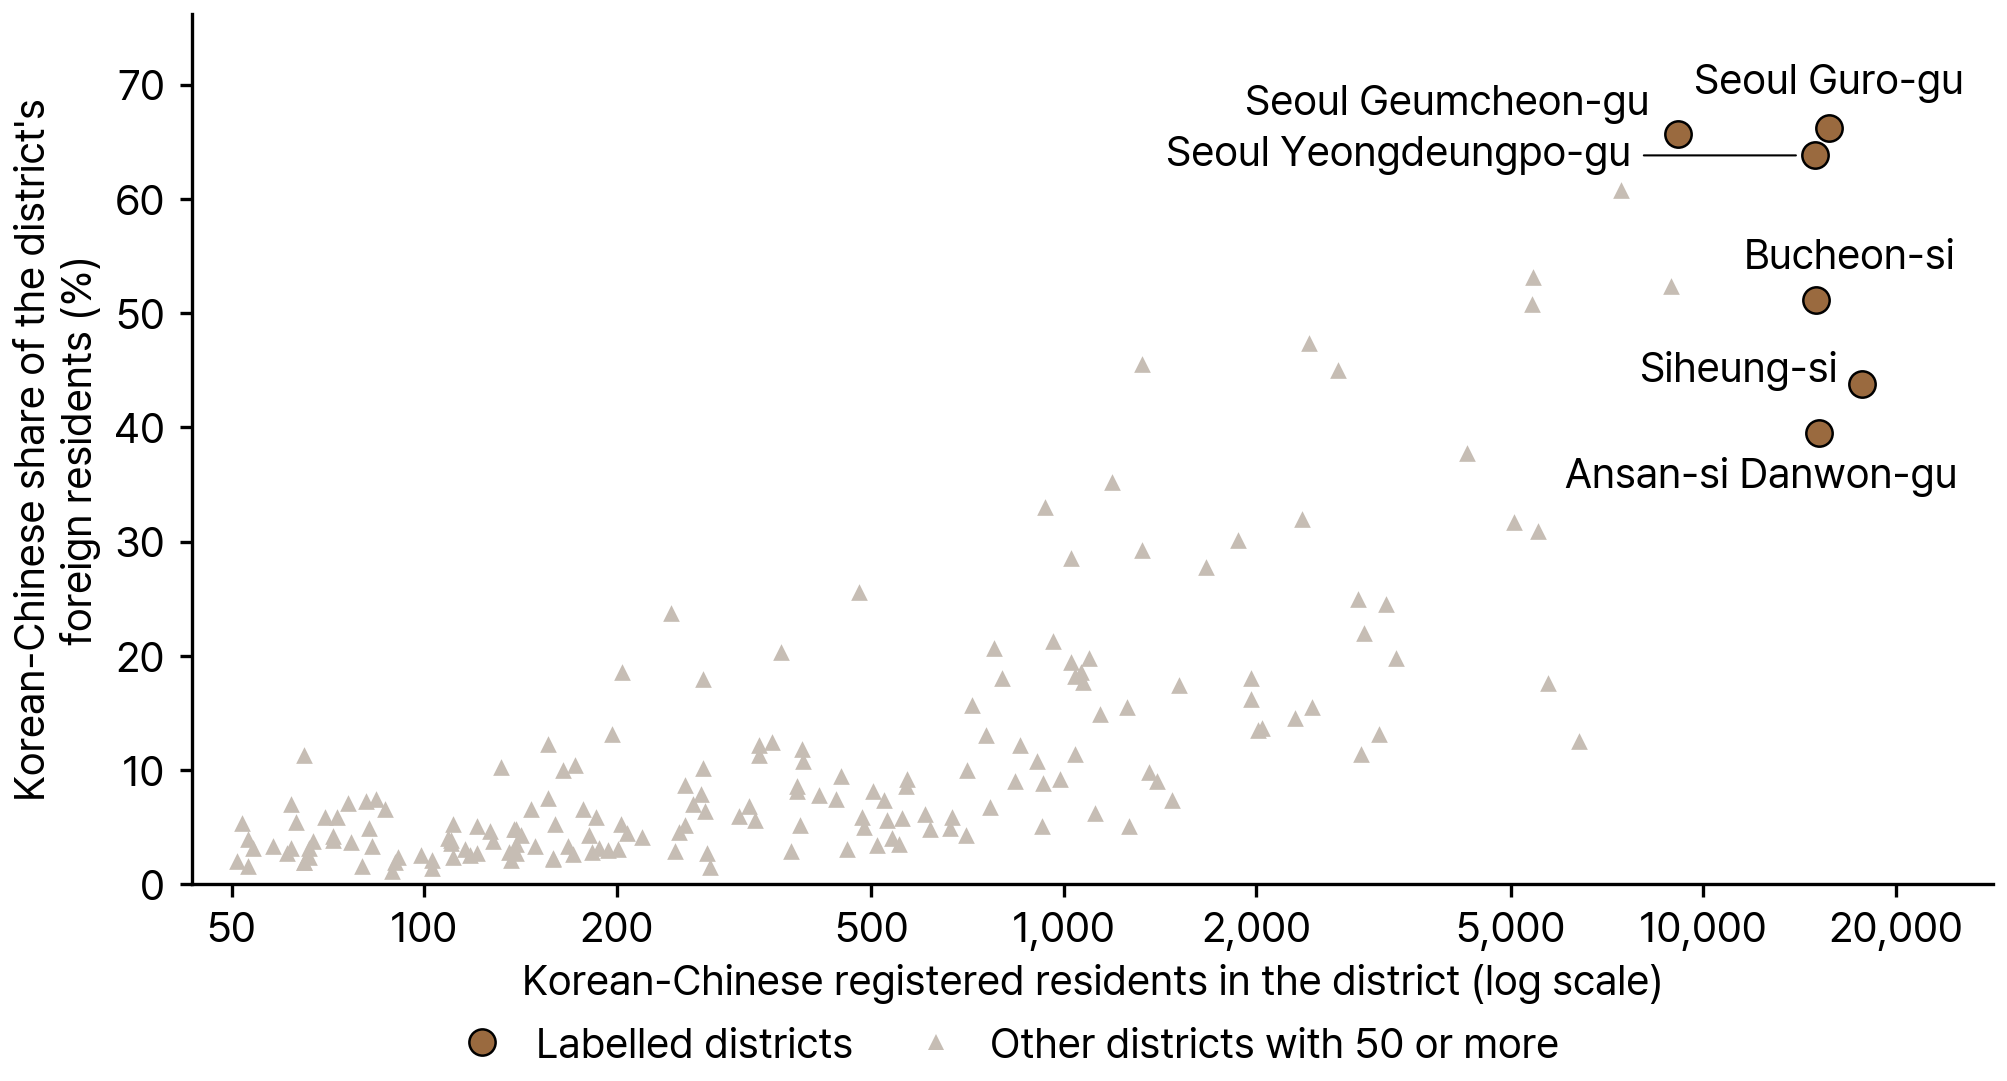
Only 3.3 percent of registered Korean-Chinese lived in rural counties (gun), compared with 10.6 percent of all registered foreigners. The group numbered at least 100 in 154 districts in 2024, and the ten largest districts accounted for 47.0 percent of the registered population. Siheung-si in Gyeonggi was the largest (17,727), followed by Seoul Guro-gu (15,726) and Ansan-si Danwon-gu (15,146).
In three Seoul districts Korean-Chinese made up about two-thirds of registered foreigners in 2024: Guro-gu (66.2 percent), Geumcheon-gu (65.7 percent), and Yeongdeungpo-gu (63.8 percent). A 2022 study describes settlement that began in Garibong-dong, expanded to Daerim-dong in Yeongdeungpo-gu and Jayang-dong in Gwangjin-gu, and later extended to Gyeonggi cities such as Bucheon and Ansan (Ahn 2022).
Source: KIRD dataset, from Ministry of Justice registered-foreigner statistics by district, 2024. Districts with 50 or more Korean-Chinese residents.
Table 2Ten Districts with the Most Registered Korean-Chinese Residents, 2024
| District | Province | Korean-Chinese residents | Share of district's foreign residents (%) |
|---|---|---|---|
| Siheung-si | Gyeonggi-do | 17,727 | 43.8 |
| Guro-gu | Seoul | 15,726 | 66.2 |
| Ansan-si Danwon-gu | Gyeonggi-do | 15,146 | 39.5 |
| Bucheon-si | Gyeonggi-do | 14,979 | 51.1 |
| Yeongdeungpo-gu | Seoul | 14,933 | 63.8 |
| Geumcheon-gu | Seoul | 9,133 | 65.7 |
| Bupyeong-gu | Incheon | 8,903 | 52.3 |
| Suwon-si Paldal-gu | Gyeonggi-do | 7,431 | 60.8 |
| Hwaseong-si | Gyeonggi-do | 6,389 | 12.5 |
| Pyeongtaek-si | Gyeonggi-do | 5,727 | 17.6 |
Note: Registered foreigners only. The ten districts together accounted for 47.0 percent of registered Korean-Chinese residents.
Source: KIRD dataset, from Ministry of Justice registered-foreigner statistics by district, 2024.
The index of dissimilarity (D) measures the share of a group that would have to move for its district distribution to match that of Koreans. For Korean-Chinese, D rose from 0.493 in 2014 to 0.516 in 2024.
KIRD defines an ethnic enclave as a district where the group's location quotient is at least 2 and the group makes up at least 30 percent of the district's registered foreigners. Fifteen districts met both conditions for Korean-Chinese in 2024. The highest location quotients were in Ansan-si Danwon-gu (10.7; 15,146 residents, 39.5 percent of registered foreigners), Seoul Guro-gu (8.4; 66.2 percent), Seoul Geumcheon-gu (8.4; 65.7 percent), and Seoul Yeongdeungpo-gu (8.3; 63.8 percent). The other eleven were Suwon-si Paldal-gu, Siheung-si, Osan-si, Bucheon-si, Seongnam-si Sujeong-gu, Incheon Bupyeong-gu, Ansan-si Sangnok-gu, Suwon-si Gwonseon-gu, Seoul Gwanak-gu, Gunpo-si, and Anyang-si Manan-gu.
Age and Sex
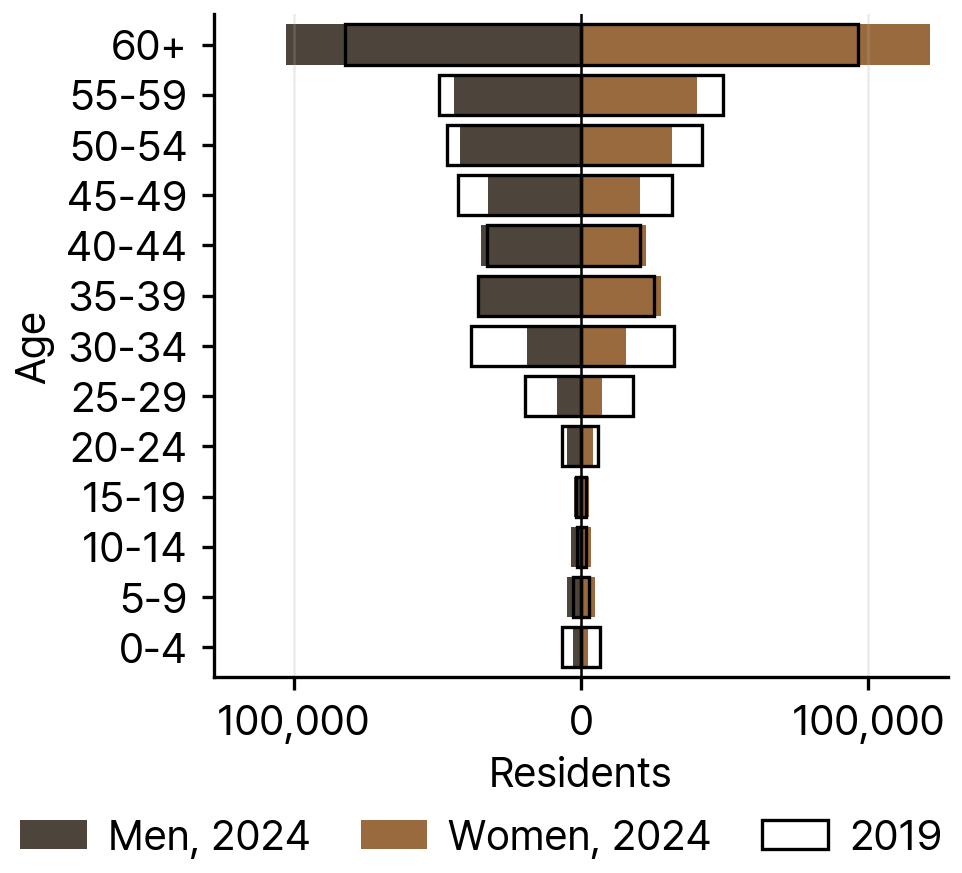
Women made up 47.5 percent of Korean-Chinese residents in 2024 (305,294), compared with 45.1 percent of all resident foreigners. The share was 47.6 percent in 2019.
The population is much older than the overall foreign population. In 2024, 34.9 percent of Korean-Chinese residents were age 60 or older, the largest age group, compared with 12.9 percent of all resident foreigners, and the median fell in the 50-54 age group. Residents age 50 or older numbered 382,689 in 2024, up from 365,890 in 2019. Those ages 20 to 39 made up 19.2 percent (123,464), against 49.7 percent of all resident foreigners, and their number fell from 182,001 in 2019.
Children under age 15 made up 3.4 percent of Korean-Chinese residents in 2024 (21,659), compared with 5.7 percent of all resident foreigners. Children under age 5 fell from 13,125 in 2019 to 5,245 in 2024.
Source: KIRD dataset, from Ministry of Justice immigration yearbooks, 2006-2024.
Visa Status
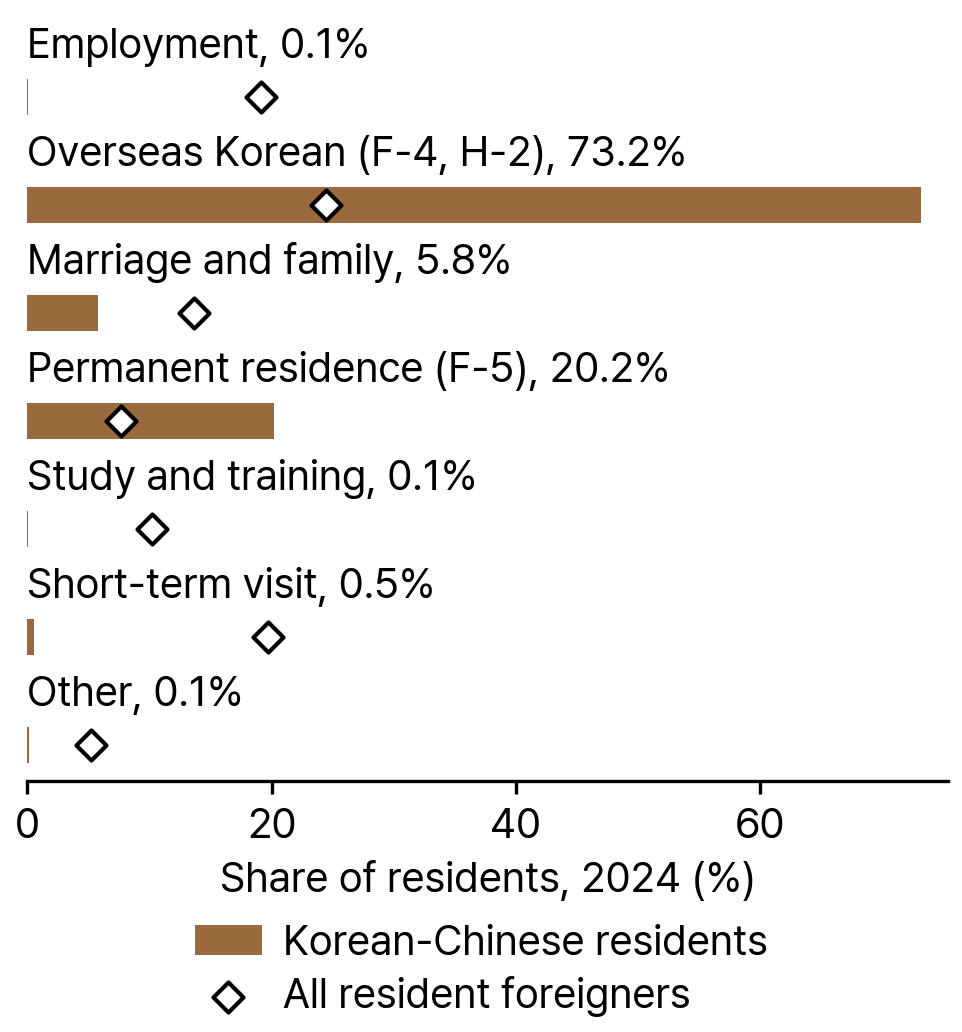
In 2024, 73.2 percent of Korean-Chinese residents held one of the two overseas-Korean visas (F-4 or H-2), compared with 24.5 percent of all resident foreigners. Another 20.2 percent held permanent residence (F-5), against 7.7 percent of all resident foreigners, and 5.8 percent held marriage or family visas, against 13.6 percent. Employment visas (0.1 percent), study and training visas (0.1 percent), and short-term visit visas (0.5 percent) were rare among Korean-Chinese, while these categories covered 19.2, 10.2, and 19.7 percent of all resident foreigners.
Source: KIRD dataset, from Ministry of Justice immigration yearbooks, 2006-2024.
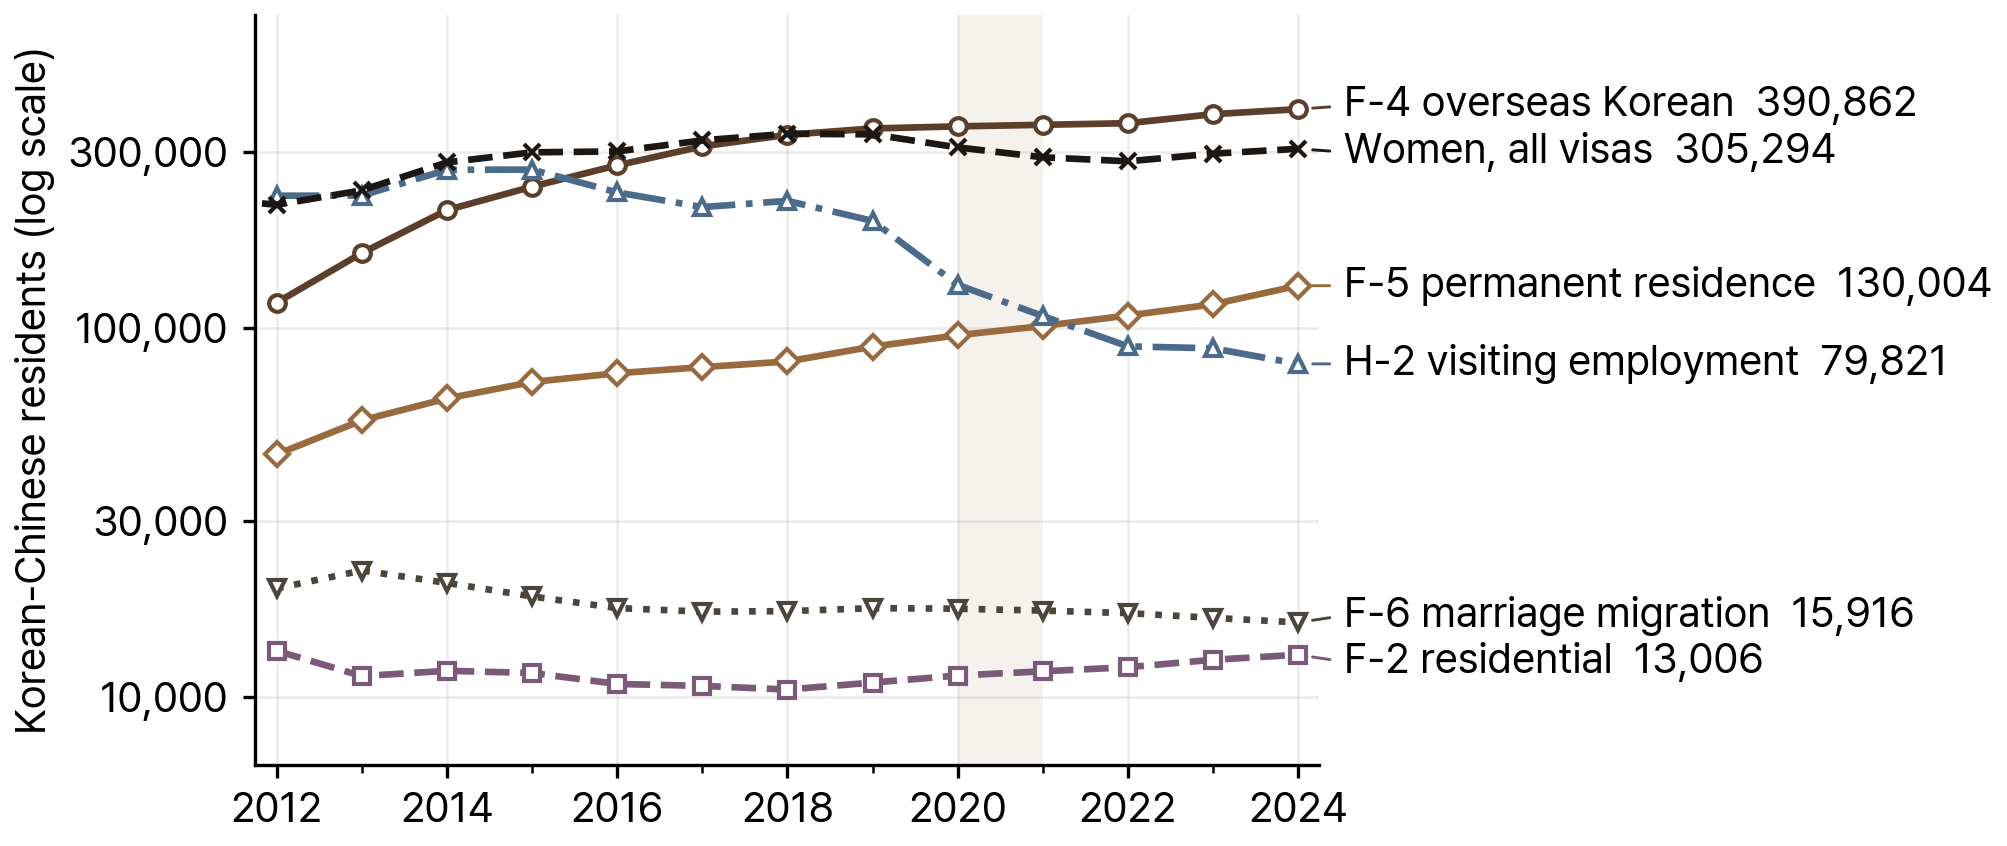
The F-4 Overseas Korean visa was the most common status, held by 390,862 Korean-Chinese (60.8 percent) in 2024. Korean-Chinese held 70.3 percent of all F-4 visas in Korea, the most of any nationality. They also held 85.6 percent of all H-2 visas and 64.1 percent of all F-5 permanent residence visas.
The visa mix changed over the decade. In 2014, H-2 holders (267,768) outnumbered F-4 holders (208,312). By 2024 H-2 holders had fallen to 79,821, while F-4 holders had risen to 390,862 and F-5 holders from 64,337 to 130,004. Between 2019 and 2024, F-1 (Visiting Cohabitation) holders fell from 20,490 to 7,463 and C-3 (Short-term Visit) holders from 19,217 to 3,382.
Source: KIRD dataset, from Ministry of Justice immigration yearbooks, 2006-2024.
Table 3Korean-Chinese Residents by Visa Type, 2019 and 2024
| Visa | Meaning | 2019 | 2024 | Share of Korean-Chinese residents, 2024 (%) | Korean-Chinese share of all holders of the visa, 2024 (%) |
|---|---|---|---|---|---|
| F-4 | Overseas Korean | 346,539 | 390,862 | 60.8 | 70.3 |
| F-5 | Permanent Residence | 88,888 | 130,004 | 20.2 | 64.1 |
| H-2 | Visiting Employment | 194,792 | 79,821 | 12.4 | 85.6 |
| F-6 | Marriage Migration | 17,398 | 15,916 | 2.5 | 10.7 |
| F-2 | Residential | 10,938 | 13,006 | 2.0 | 21.2 |
| F-1 | Visiting Cohabitation | 20,490 | 7,463 | 1.2 | 7.5 |
| C-3 | Short-term Visit | 19,217 | 3,382 | 0.5 | 2.1 |
Note: Resident foreigners, 31 December. Shares of Korean-Chinese residents use the 2024 total of 643,277.
Source: KIRD dataset, from Ministry of Justice immigration yearbooks, 2006-2024.
Migration Channels and Policy
Korean-Chinese workers come to Korea outside the general Employment Permit System. HRD Korea, which runs the H-2 employment program, lists the target of the H-2 special employment permit as foreign nationals of Korean ethnicity residing in China or the former Soviet Union, and presents it as a track distinct from the general permit system (HRD Korea 2026). China also appears on the list of countries covered by the E-9 electronic visa arrangement for general foreign workers (Ministry of Employment and Labor 2026), a route used by Chinese nationals outside the Korean-Chinese category.
On February 12, 2026, the Ministry of Justice merged H-2 status into F-4 regardless of country of origin, describing the change as a response to complaints of unequal treatment by origin country among about 860,000 co-ethnic residents (Ministry of Justice 2026). Under the same reform, 10 of the 47 simple-labor occupations previously closed to F-4 holders were opened, including construction laborer, manual packer, and loading and stocking worker (World Korean News 2026). The KIRD figures in this profile end in December 2024 and predate the merger.
Naturalization
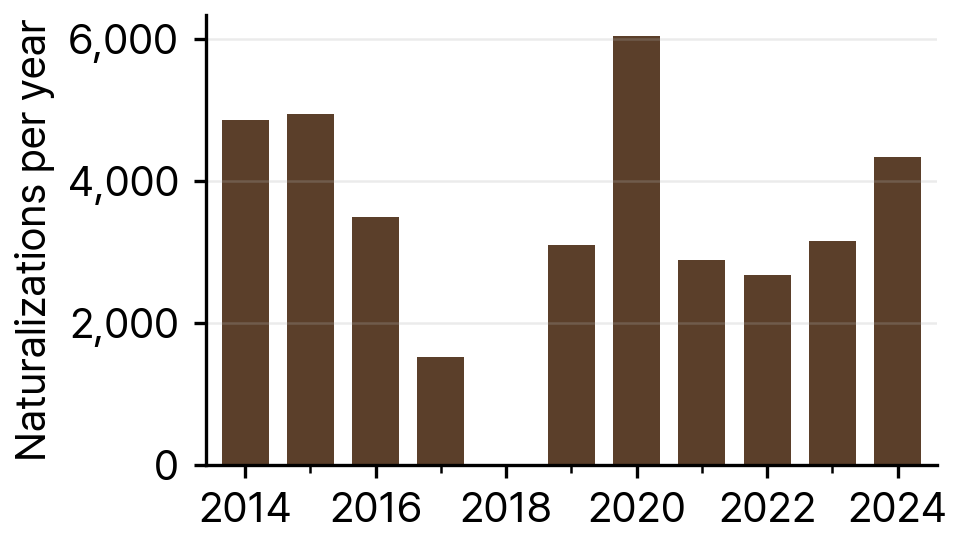
Ministry of Justice yearbooks report Korean-Chinese naturalizations separately for 2014-17 and 2019-24; no separate count is available for 2009-13 or 2018. Across those ten years, 36,970 Korean-Chinese acquired Korean nationality by naturalization. Annual counts ranged from 1,521 in 2017 to 6,031 in 2020, and 4,334 were naturalized in 2024.
Source: KIRD dataset, from Ministry of Justice immigration yearbooks, 2006-2024.
A second route, restoration of nationality, applies to former Korean nationals. The yearbooks record 2,086 restorations of Korean nationality by Korean-Chinese from 2011 to 2024 (also excluding 2018), including 53 in 2024.
Unauthorized Residents
Korean-Chinese are not among the ten nationalities that the Ministry of Justice yearbook (table 6-4) reports separately, so no count of unauthorized Korean-Chinese residents is published. The yearbook counted 397,522 unauthorized residents of all nationalities in 2024.
Health and Well-being
A pooled analysis of 13,443 Korean-Chinese waged workers from the 2018, 2020, and 2022 Survey on Immigrants' Living Conditions and Labor Force linked perceived ethnic discrimination with poor self-rated health. Among women who had experienced discrimination, asked for fair treatment, and saw the situation improve, the odds of poor self-rated health were 2.63 times those of women who had not experienced discrimination (95% CI 1.29-5.38); the equivalent estimate for men was 0.87 (95% CI 0.30-2.53) (Lee et al. 2024).
A survey of 399 Korean-Chinese adults in and around Seoul measured depression for 292 respondents, whose mean CES-D-K score was 9.3; 20.6 percent scored at or above the clinical cutoff of 16. The association between perceived discrimination and depression was stronger among respondents who identified more as Korean than as Chinese (Hong 2019). An earlier study of 170 full-time Korean-Chinese migrant workers found that roughly 30 percent met criteria for depression, and acculturative stress and work-related psychosocial factors explained 26.3 percent of the variance in depression scores (Lee et al. 2012).
Of 305 migrant-worker deaths recognized as compensable industrial accidents in 2016-18, 174 were Korean-Chinese, followed by Chinese nationals (37), Nepalis (15), and Vietnamese (11) (Seoul Shinmun 2019).
Migration from China's Korean Communities to South Korea
The Ministry of Justice counted 864,245 foreign-national overseas Koreans living in South Korea at the end of 2024, and Chinese nationals of Korean ethnicity made up 77.3 percent of them (EKW 2024). China's census counted 1,923,842 ethnic Koreans in 2000 and 1,702,479 in 2020, a fall of 221,363; the report on the 2020 census names migration to South Korea for work after the 1992 normalization of China-Korea relations as the main cause (Koreancenter 2022). In January 2020, about 708,000 Korean-Chinese lived in South Korea, more than the roughly 597,000 ethnic Koreans in the Yanbian Korean Autonomous Prefecture (Financial News 2022). To our knowledge, no published source reports South Korea's rank among the destinations of Korean-Chinese emigrants.
Korean-Chinese do not enter through the Employment Permit System or take its EPS-TOPIK test, so no EPS applicant or deployment counts exist for the group. The H-2 Working Visit program began in March 2007, after the Constitutional Court ruled in 2001 that excluding co-ethnics in China and the former Soviet Union from the 1999 Overseas Korean Act was unconstitutional. From 2010 a visa-issuance quota capped the number of H-2 holders at 303,000 (Kang Nam Labor Law Firm 2026). Unlike E-9 workers, H-2 holders may change employers without restriction (HRD Korea 2026).
In 2007, H-2 applicants without relatives in South Korea had to score at least 200 of 400 points on a Korean-language test and then enter a computerized lottery. Places were divided by age: 20 percent for ages 25-34, 35 percent for ages 35-44, 30 percent for ages 45-54, and 15 percent for ages 55 and older (Hankook Ilbo 2007). We know of no published H-2 applicant counts against available places for any year after 2007.
Personal remittances received by China equaled 0.09 percent of GDP in 2021 and 0.13 percent in 2024, against a world average of about 4.7 percent in the same World Bank series (TheGlobalEconomy.com 2025). The World Bank's bilateral remittance estimates, last produced for 2021, put remittances sent from South Korea to China at about US$3.76 billion that year (World Bank 2021). The estimate covers all senders; to our knowledge, no source reports the part sent by Korean-Chinese.
The historic center of China's Korean population is the Yanbian Korean Autonomous Prefecture in Jilin Province. Ethnic Koreans made up 70.5 percent of Yanbian's population in 1953 and 30.8 percent (about 597,000 people) in 2020, when Han Chinese made up 65.79 percent (Koreancenter 2022). As far as we know, no published source breaks down Korea-bound migrants by province of origin.
China's Nationality Law does not recognize dual nationality (Article 3), and under Article 9 a Chinese citizen residing abroad who voluntarily acquires a foreign nationality loses Chinese nationality automatically (Lawtimes 2004). Korean-Chinese who naturalize in South Korea therefore give up Chinese nationality. We are not aware of any published description of national or Jilin provincial programs that recruit or train workers for South Korea.
Research on this migration covers brokers, debt, work, and health. A 2005 Korean Institute of Criminology study, based on interviews with a Beijing broker and a survey of 456 migrants from China, found that smuggled entry into South Korea cost an average of about 16 million won, that 41 percent of respondents had borrowed to pay it, and that about 30 percent of Korean-Chinese who entered on C-3 short-term visit visas remained without authorization (Jang 2005). Studies of workers and residents in South Korea link depression to acculturative stress, work-related psychosocial factors, and perceived discrimination, and poor self-rated health to ethnic discrimination (Lee et al. 2012; Hong 2019; Lee et al. 2024); the Health and Well-being section reports their estimates. Studies of Korean-Chinese marriage migration include Freeman's ethnography of marriage and labor migration between China and South Korea (Freeman 2011). Return to China has drawn less research; an interview study of ten Korean-Chinese who went back to Yanbian from Korea, Japan, and Chinese cities and started businesses there discusses the program the Yanbian government began in 2015 to encourage returnees to start businesses (Fang 2018).
Table 4Migration indicators, China's Korean Communities and South Korea
| Indicator | Value | Source |
|---|---|---|
| Foreign-national overseas Koreans living in South Korea, 2024 | 864,245 | EKW 2024 |
| Share of them who were Chinese nationals of Korean ethnicity, 2024 (%) | 77.3 | EKW 2024 |
| Ethnic Koreans in China, 2000 census | 1,923,842 | Koreancenter 2022 |
| Ethnic Koreans in China, 2020 census | 1,702,479 | Koreancenter 2022 |
| Korean-Chinese living in South Korea, January 2020 | about 708,000 | Financial News 2022 |
| Ethnic Koreans in Yanbian, 2020 | about 597,000 | Financial News 2022 |
| Ethnic Korean share of Yanbian population, 1953 and 2020 (%) | 70.5 and 30.8 | Koreancenter 2022 |
| Cap on H-2 visa holders, from 2010 | 303,000 | Kang Nam Labor Law Firm 2026 |
| Personal remittances received by China, 2024 (% of GDP) | 0.13 | TheGlobalEconomy.com 2025 |
Note: No EPS applicant or deployment counts exist for Korean-Chinese, who enter through the overseas-Korean visa track.
Community Organizations
A 2022 study describes Korean-Chinese as the largest foreign group in Korea's multicultural population, at about 32 percent of migrants counted in the 2020 local-government foreign resident statistics (Ahn 2022). The Korean-Chinese Students Network in Korea (KCN), founded in 2004, held a 20th-anniversary seminar at Yonsei University on January 13, 2024 (Ethnic Korean World News 2024).
The KIRD census of 1,720 migrant-serving organizations includes 13 whose name or stated target group refers to this community. They include the Overseas Koreans Agency (Incheon Yeonsu-gu), Jaehan Dongpo Yeonhap Chonghoe and Jungguk Dongpo Hanmaeum Yeonhap Chonghoe (both Seoul Guro-gu), Jungguk Dongpo Yeonhap Jungang-hoe (Seoul Geumcheon-gu), Jeonguk Dongpo Chongyeonhaphoe (Seoul Yeongdeungpo-gu), Jungguk Dongpo Yeonhaphoe and the Jungguk Dongpo-ui Jip shelter at the House of Foreign Workers (both Ansan-si Danwon-gu), and Suwon Joseonjok Dongpo Hyeophoe (Suwon-si Paldal-gu). Most general-purpose organizations in the census, such as multicultural family and foreign worker support centers, also serve Korean-Chinese residents.
Sources
Korea Immigration Regional Dashboard (KIRD) dataset, 2006-2024. openICPSR. https://doi.org/10.3886/E249944V1
HRD Korea, EPS Integrated Service. Comparison with the General Employment Permit System (H-2), 2026. https://eps.hrdkorea.or.kr/h2/h2empl/empPermComp.do
Ministry of Employment and Labor (Employ24). Foreign Worker Employment Management System, 2026. https://www.eps.go.kr/eo/EmployJobProc.eo?tabGb=01
Ministry of Justice. MOJ Implements Integration of Overseas-Korean Residence Status into F-4, 2026. https://www.moj.go.kr/bbs/moj/182/603456/artclView.do
World Korean News. Overseas Korean residence visas integrated, new H-2 issuance halted, 2026. https://www.worldkorean.net/news/articleView.html?idxno=56122
Koreancenter. Ethnic Korean population in China at 1.7 million, down 220,000 over 20 years, 2022. https://www.koreancenter.or.kr/news/articleView.html?idxno=588368
Financial News. 700,000 in Korea: more Korean-Chinese live in Korea than in Yanbian, 2022. https://www.fnnews.com/news/202201200812124380
Seoul Shinmun. Migrant workers at risk: 305 recognized deaths in the last three years, 2019. https://www.seoul.co.kr/news/society/2019/09/24/20190924500160
Ahn, Nuri. 2022. Socio-economic Divergence and Reorganization Movement of Residential Concentrations of Korean-Chinese in Korea. Journal of the Korean Geographical Society 57 (5): 451-462. https://doi.org/10.22776/kgs.2022.57.5.451
Ethnic Korean World News (EKW). Korean-Chinese Students Network in Korea holds 20th-anniversary seminar, 2024. https://www.ekw.co.kr/news/articleView.html?idxno=11478
Lee, H., Kim, J. H., Lee, G., Lee, H., Huq, M., Devakumar, D., & Kim, S. S. (2024). Ethnic discrimination, asking for fair treatment, and poor self-rated health: A gender stratified analysis of 13,443 Korean Chinese waged workers in South Korea. International Journal for Equity in Health, 23, 82. https://doi.org/10.1186/s12939-024-02160-0
Hong, J. (2019). Effects of ethnic identity on the relationship between mental health and perceived discrimination among ethnic return migrants: The case of Korean Chinese return-migrated to South Korea. Journal of Immigrant and Minority Health, 21(3), 522-532. https://doi.org/10.1007/s10903-018-0775-9
Lee, H., Ahn, H., Miller, A., Park, C. G., & Kim, S. J. (2012). Acculturative stress, work-related psychosocial factors and depression in Korean-Chinese migrant workers in Korea. Journal of Occupational Health, 54(3), 206-214. https://doi.org/10.1539/joh.11-0206-OA
Jang, J. (2005). Milipguk-ui siltae-wa daechaek: Hanguk-gwa Jungguk [Illegal entry from China into Korea] (Research Report 05-28). Korean Institute of Criminology. https://www.kicj.re.kr/boardDownload.es?bid=0001&list_no=9851&seq=1
Ethnic Korean World News (EKW). Ministry of Justice 2024 immigration statistics yearbook: long-term residents exceed 2 million, foreign-national overseas Koreans increasing, 2024. https://www.ekw.co.kr/news/curationView.html?idxno=12302
Kang Nam Labor Law Firm. The Working Visit program and inclusion policy for Korean-Chinese, 2026. https://k-labor.co.kr/main/klabor_04_view.html?pgubun=8&lang=ko&find=&chapter_idx=464&items_idx=6872
Hankook Ilbo. Korean-Chinese scoring 200 or more on Korean test included in Working Visit lottery, 2007. https://www.hankookilbo.com/news/article/200704222388662611
TheGlobalEconomy.com. China: Remittances, percent of GDP (World Bank data), 2025. https://www.theglobaleconomy.com/China/remittances_percent_GDP/
Lawtimes. The nationality system of China, 2004. https://www.lawtimes.co.kr/news/articleView.html?idxno=14175
World Bank. 2021. Bilateral Remittance Estimates (WB_KNOMAD_BRE), Data360. https://data360api.worldbank.org/data360/data?DATABASE_ID=WB_KNOMAD&INDICATOR=WB_KNOMAD_BRE&REF_AREA=KOR
Freeman, C. (2011). Making and faking kinship: Marriage and labor migration between China and South Korea. Cornell University Press. https://cornellpress.cornell.edu/book/9780801449581/making-and-faking-kinship/
Fang, M.-H. (2018). 연변지역 '귀환' 조선족 창업과정 사례와 정책과제 [Examples and policy issues in the process of returning Chinese-Koreans' business start-ups in the Yanbian region]. 한국학연구 (Korean Studies), 51, 37-66. https://korea.inha.ac.kr/sites/inhakorea/upfiles/tb_kor_study/51/2.%20%EC%97%B0%EB%B3%80%EC%A7%80%EC%97%AD%20%E2%80%98%EA%B7%80%ED%99%98%E2%80%99%20%EC%A1%B0%EC%84%A0%EC%A1%B1%20%EC%B0%BD%EC%97%85%EA%B3%BC%EC%A0%95%20%EC%82%AC%EB%A1%80%EC%99%80%20%EC%A0%95%EC%B1%85%EA%B3%BC%EC%A0%9C%E2%88%A5%EB%B0%A9%EB%AF%B8%ED%99%94.pdf
Suggested citation: Korea Immigration Regional Dashboard (KIRD). 2026. “Korean-Chinese Immigrants in South Korea.” Foreign Residents in South Korea series, September 2026. Data: Korea Immigration Regional Dashboard (KIRD) dataset, https://doi.org/10.3886/E249944V1. Interactive maps and tables: https://immigrantsinkorea.today.