 Korea Immigration Regional Dashboard
Frequently requested statisticsSeptember 2026Download PDF
Frequently Requested Statistics on Foreign Residents in South Korea
Highlights
- South Korea had 2,650,783 resident foreigners at the end of 2024, 2.9 times the 2006 count and equal to 5.2 percent of its resident-registration population of Korean nationals.
- The Korean-Chinese (643,277) and other Chinese nationals (315,682) were the two largest groups, and the ten largest nationalities made up 75.5 percent of all resident foreigners.
- The overseas-Korean F-4 visa was the most common status, with 555,968 holders; 337,279 people had the E-9 work visa of the Employment Permit System.
- Seoul, Incheon and Gyeonggi were home to 55.2 percent of registered foreigners in 2024, down from 65.6 percent in 2008.
- In May 2025 an estimated 1,109,000 foreign residents aged 15 and over were employed, 44.9 percent of them in mining and manufacturing, against 15.2 percent of all employed people.
South Korea's foreign-resident population was 2,650,783 at the end of 2024, 2.9 times its 2006 level and equal to 5.2 percent of the resident-registration population of Korean nationals. This page answers the questions most often asked about that population, from its size and origins to visas, education, work and wages, health insurance, naturalization, unauthorized stay and enforcement, asylum, languages and the organizations that serve it.
Most figures come from the Korea Immigration Service Statistical Yearbooks of the Ministry of Justice and the Local Government Foreign Resident Status of the Ministry of the Interior and Safety, as harmonized in the KIRD dataset for 2006-2024, and 2024 is the reference year for those counts. The questions on unauthorized residents, enforcement and refugees use MOJ figures for 2025. The questions on education, work and wages draw on the Survey on Immigrants' Living Conditions and Labour Force of May 2025, and the question on health insurance on National Health Insurance Service data for 2024 and 2025. Where an official figure for Korean nationals or for the population as a whole exists, the answers report it alongside. Companion Spotlights profile the 20 nationalities with more than 20,000 resident foreigners.
Numbers and Growth
Number of foreign residents
How many foreign residents live in South Korea?
Korean government statistics count foreign residents in three different ways, and the totals differ by as much as 1,162,430 people. On 31 December 2024 the Ministry of Justice (MOJ) counted 2,650,783 resident foreigners (체류외국인), the broadest MOJ measure: everyone in the country on a foreign passport that day, including short-term visitors. Of these, 1,488,353 (56.1 percent) were registered foreigners (등록외국인), people resident for more than 90 days who completed alien registration; 553,664 were ethnic Koreans with foreign nationality who filed a residence report (거소신고) under the Overseas Koreans Act; and the remaining 608,766 (23.0 percent) were short-term stays.
The Ministry of the Interior and Safety (MOIS) publishes a third count, foreign-origin residents (외국인주민), with a reference date of 1 November 2024. It was 2,583,626 and adds two groups the MOJ counts exclude because they hold Korean nationality: 245,578 people who acquired Korean nationality and 295,304 children of foreign residents or naturalized citizens. The remaining 2,042,744 are residents without Korean nationality, a figure close to the MOJ long-term population of registered foreigners plus residence reports (2,042,017).
Which number to quote depends on the question. The resident-foreigner count (2,650,783) is the one MOJ uses for its headline figure; the registered count (1,488,353) is the only one published for every district with nationality and visa detail; and the MOIS count (2,583,626) is the one local governments use to plan services, because it includes naturalized citizens and children.
Table 1Three official counts of foreign residents in South Korea, 2024
| Measure | Publisher and reference date | Persons | What it covers |
|---|---|---|---|
| Resident foreigners (체류외국인) | MOJ, 31 Dec | 2,650,783 | All foreign nationals present, including short-term stays |
| Registered foreigners (등록외국인) | MOJ, 31 Dec | 1,488,353 | Stays over 90 days with alien registration |
| Overseas Korean residence reports (거소신고) | MOJ, 31 Dec | 553,664 | F-4 holders who report a residence instead of registering |
| Short-term stays | MOJ, 31 Dec | 608,766 | Remainder: visa-free, tourist and other stays of 90 days or less |
| Foreign-origin residents (외국인주민) | MOIS, 1 Nov | 2,583,626 | Foreign nationals resident over 90 days, naturalized citizens, and children |
| Without Korean nationality | MOIS, 1 Nov | 2,042,744 | Workers, marriage migrants, students, ethnic Koreans, others |
| Naturalized citizens | MOIS, 1 Nov | 245,578 | Acquired Korean nationality |
| Children | MOIS, 1 Nov | 295,304 | Children of foreign residents and naturalized citizens |
Note: Short-term stays are derived as resident foreigners minus registered foreigners minus residence reports. Indented rows are components of the row above them.
Source: KIRD dataset: nationality_national.csv, diaspora_residence_by_sido.csv and national_annual.csv, from MOJ yearbooks and MOIS Local Government Foreign Resident Status.
Dashboard: National statistics
Sources: Ministry of Justice (MOJ), Korea Immigration Service Statistical Yearbooks (출입국·외국인정책 통계연보), 2006-2025 editions (link); Ministry of the Interior and Safety (MOIS), 2024 Local Government Foreign Resident Status (2024 지방자치단체 외국인주민 현황), reference date 1 November 2024 (link); Korea Immigration Regional Dashboard (KIRD). (2026). Spatiotemporal administrative dataset of nationality, residential diversity, and language demand among immigrants in South Korea, 2006-2024 [Data set]. Ann Arbor, MI: openICPSR (link)
Change since 2006
How has the number of foreign residents changed since 2006?
The resident-foreigner population grew from 910,149 in 2006 to 2,650,783 in 2024, a 2.9-fold increase over 18 years, while the resident-registration population of Korean nationals grew 4.5 percent, from 48,991,779 to 51,217,221. Registered foreigners rose from 631,219 to 1,488,353 over the same period. Growth was steady through 2019, when resident foreigners numbered 2,524,656.
The COVID-19 pandemic reversed that trend. Border restrictions cut short-term entries and delayed the arrival of new workers and students, and the resident-foreigner count fell to 1,956,781 in 2021, 22.5 percent below 2019. Registered foreigners fell by 14.0 percent over the same two years, from 1,271,807 to 1,093,891, and the resident-registration population of Korean nationals by 0.4 percent. The MOIS foreign-origin count, which includes naturalized citizens and children, changed much less: it was 2,216,612 in 2019 and 2,134,569 in 2021.
Recovery was fast. By 2024 the resident-foreigner population stood 5.0 percent above its 2019 level and the registered population 17.0 percent above it. Between 2023 and 2024 alone, the resident-foreigner count grew by 143,199 and the registered count by 139,727, while the resident-registration population of Korean nationals fell by 108,108.
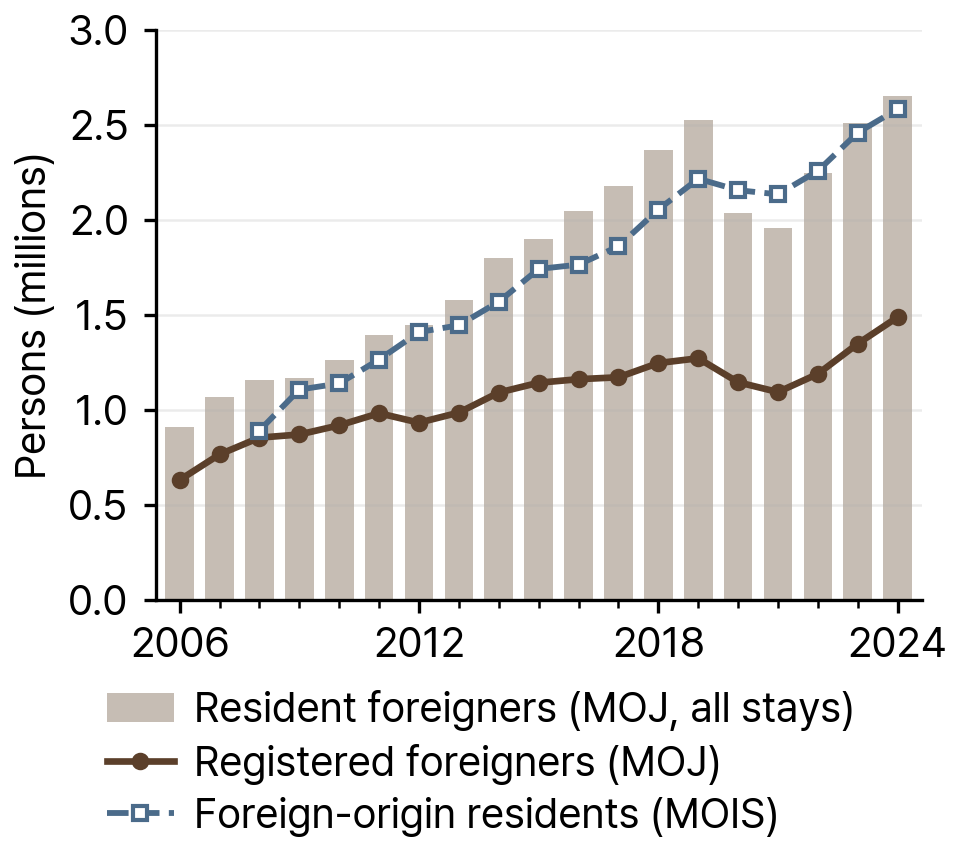
Source: KIRD dataset, built from MOJ Korea Immigration Service Statistical Yearbooks and MOIS Local Government Foreign Resident Status (nationality_national.csv, national_annual.csv). The MOIS series starts in 2008 in the released panel.
Dashboard: National statistics
Sources: Ministry of Justice (MOJ), Korea Immigration Service Statistical Yearbooks (출입국·외국인정책 통계연보), 2006-2025 editions (link); Korea Immigration Regional Dashboard (KIRD). (2026). Spatiotemporal administrative dataset of nationality, residential diversity, and language demand among immigrants in South Korea, 2006-2024 [Data set]. Ann Arbor, MI: openICPSR (link)
Population share
What share of Korea's population is foreign?
Resident foreigners equaled 5.2 percent of Korea's resident-registration population of 51,217,221 in 2024, up from 1.9 percent in 2006. The denominator is the register of Korean nationals, which does not include foreigners. Counted instead as a share of everyone present (Korean nationals plus resident foreigners), the figure is 4.9 percent.
On the narrower registered basis the share was 2.91 percent in 2024, and on the MOIS foreign-origin basis it was 5.0 percent of the same denominator.
The registered share varies across the country. It was highest in Chungcheongnam-do (4.5 percent), Jeju-do (4.2 percent) and Chungcheongbuk-do (3.5 percent), and lowest in Sejong (1.6 percent) and Daegu (1.6 percent). Of the 250 districts in the panel, 38 had a registered-foreigner share of 5 percent or more in 2024 and 5 had 10 percent or more.
Dashboard: National map; Foreign residents by province and district
Sources: Ministry of Justice (MOJ), Korea Immigration Service Statistical Yearbooks (출입국·외국인정책 통계연보), 2006-2025 editions (link); Korea Immigration Regional Dashboard (KIRD). (2026). Spatiotemporal administrative dataset of nationality, residential diversity, and language demand among immigrants in South Korea, 2006-2024 [Data set]. Ann Arbor, MI: openICPSR (link)
Origins and Places of Residence
Countries of origin
Where do foreign residents come from?
The yearbook lists 200 nationalities among resident foreigners in 2024. The ten largest groups accounted for 75.5 percent of the total. MOJ reports ethnic Koreans with Chinese nationality (한국계중국인, Korean-Chinese) separately from other Chinese nationals: the 643,277 Korean-Chinese residents were the largest single group, and the 315,682 other Chinese nationals ranked second. Together, Chinese nationals of both kinds numbered 958,959, or 36.2 percent of all resident foreigners.
Vietnam (305,936) was third and gained more residents than any other nationality between 2014 and 2024 (+175,963). Thailand (188,770) and the United States (170,251) followed. The Korean-Chinese population was 590,856 in 2014, so it grew by 52,421 while its share of the total fell.
The regional mix has moved from East Asia toward Southeast, South and Central Asia. East Asia (China, the Korean-Chinese, Japan, Taiwan, Mongolia and Hong Kong) accounted for 56.5 percent of resident foreigners in 2014 and 42.7 percent in 2024. Southeast Asia rose from 21.9 to 30.0 percent, South Asia from 5.0 to 6.7 percent, and Central Asia from 3.2 to 7.2 percent.
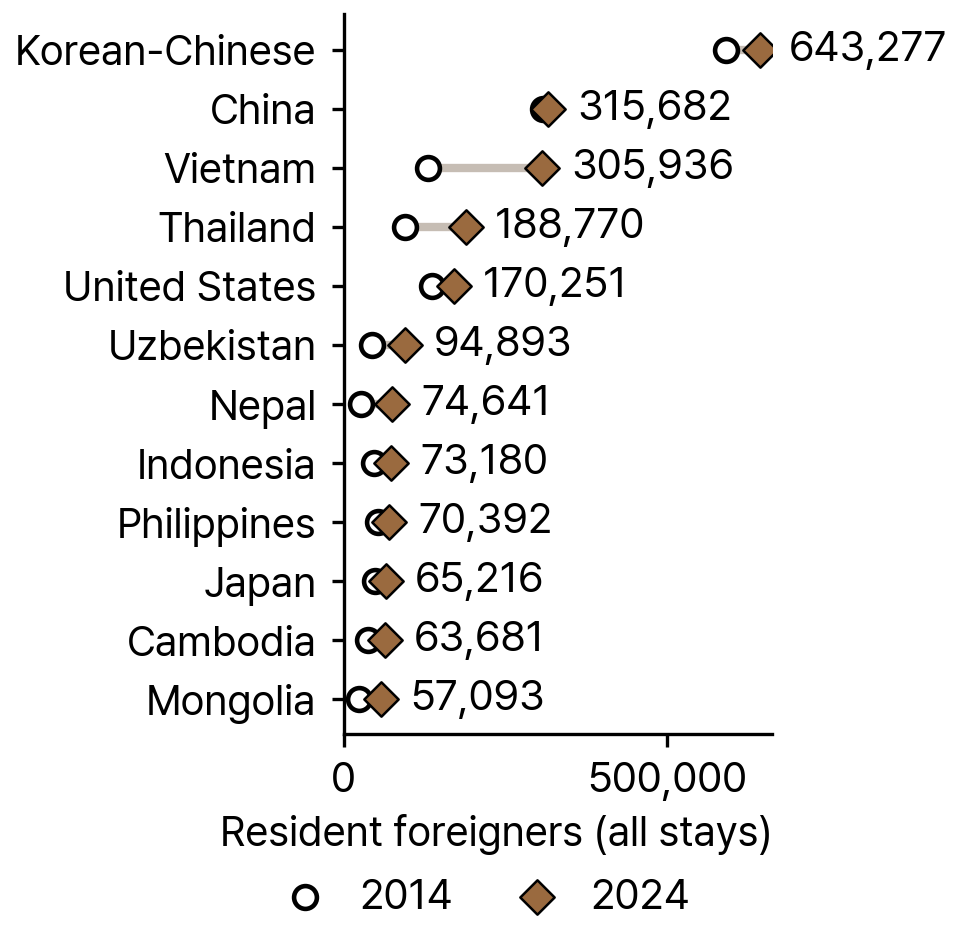
Source: KIRD dataset, built from MOJ Korea Immigration Service Statistical Yearbooks (nationality_national.csv, population = stay). Labels give the 2024 count.
Table 2Ten largest nationalities of resident foreigners, 2014 and 2024
| Nationality | 2014 | 2024 | Change 2014-2024 (%) | Share of all, 2024 (%) |
|---|---|---|---|---|
| Korean-Chinese | 590,856 | 643,277 | 8.9 | 24.3 |
| China | 307,798 | 315,682 | 2.6 | 11.9 |
| Vietnam | 129,973 | 305,936 | 135.4 | 11.5 |
| Thailand | 94,314 | 188,770 | 100.2 | 7.1 |
| United States | 136,663 | 170,251 | 24.6 | 6.4 |
| Uzbekistan | 43,852 | 94,893 | 116.4 | 3.6 |
| Nepal | 26,790 | 74,641 | 178.6 | 2.8 |
| Indonesia | 46,945 | 73,180 | 55.9 | 2.8 |
| Philippines | 53,538 | 70,392 | 31.5 | 2.7 |
| Japan | 49,152 | 65,216 | 32.7 | 2.5 |
Note: Resident foreigners include short-term stays. MOJ lists Korean-Chinese (ethnic Koreans with Chinese nationality) separately from other Chinese nationals.
Source: KIRD dataset, built from MOJ Korea Immigration Service Statistical Yearbooks (nationality_national.csv, population = stay).
Dashboard: Foreign residents by nationality
Sources: Ministry of Justice (MOJ), Korea Immigration Service Statistical Yearbooks (출입국·외국인정책 통계연보), 2006-2025 editions (link); Korea Immigration Regional Dashboard (KIRD). (2026). Spatiotemporal administrative dataset of nationality, residential diversity, and language demand among immigrants in South Korea, 2006-2024 [Data set]. Ann Arbor, MI: openICPSR (link)
Residential geography
Where in Korea do foreign residents live?
Registered foreigners are the measure MOJ publishes by district, and 1,488,353 of them had a district of residence on record in 2024. Gyeonggi Province, which surrounds Seoul, held 467,398 (31.4 percent) and Seoul 265,544 (17.8 percent). The capital region of Seoul, Incheon and Gyeonggi together accounted for 55.2 percent of registered foreigners, down from 65.6 percent in 2008 and slightly above the 50.9 percent of Korean nationals who live there.
Outside the capital region, the largest provincial populations were in Gyeongsangnam-do (102,333) and Chungcheongnam-do (96,687). Rural counties (gun) held 10.6 percent of registered foreigners in 2024, compared with 8.2 percent of Korean nationals.
The districts with the most registered foreigners were Hwaseong-si (51,059), Siheung-si (40,493), Ansan-si Danwon-gu (38,321), Pyeongtaek-si (32,489), Bucheon-si (29,304). The highest shares were in smaller places. In Yeongam-gun (Jeollanam-do) registered foreigners equaled 18.8 percent of the resident population, and in Eumseong-gun (Chungcheongbuk-do) 15.1 percent. Five of the ten districts with the highest shares were rural counties.
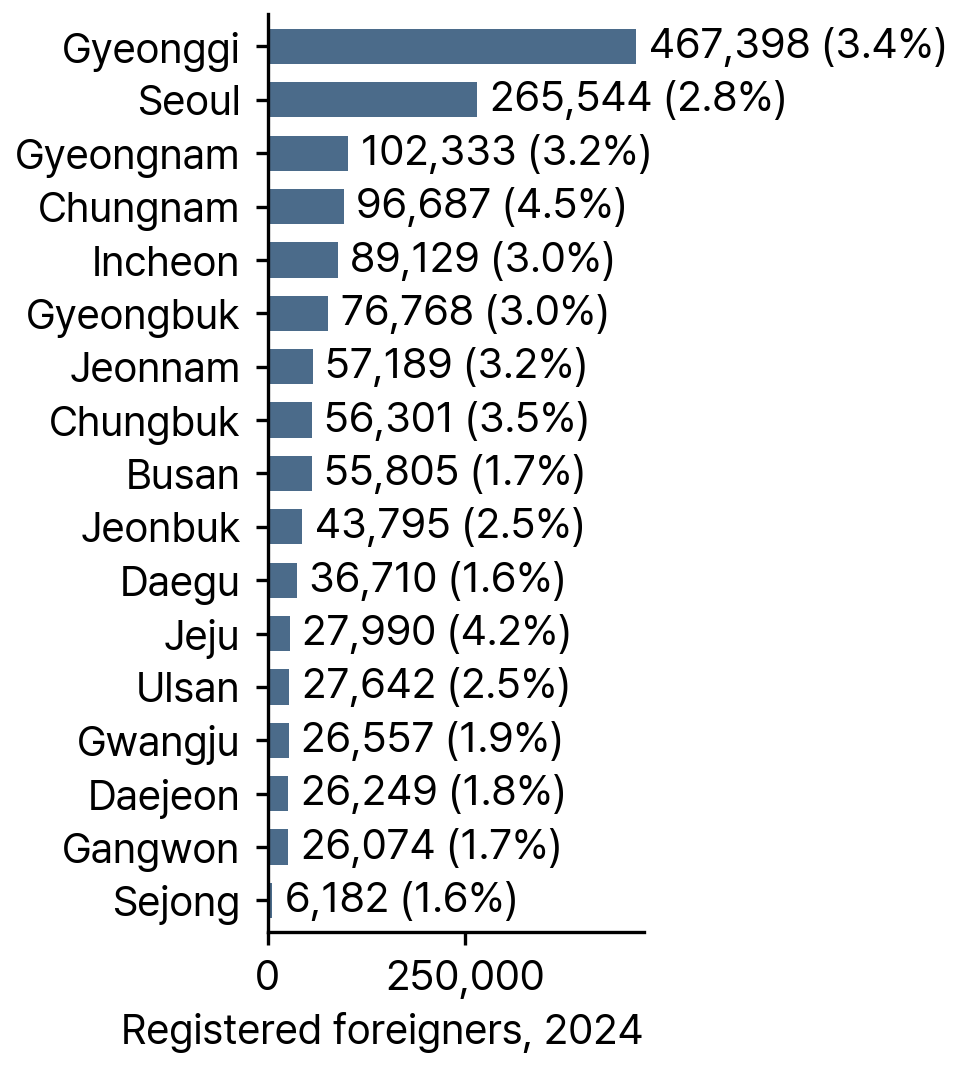
Source: KIRD dataset, built from MOJ Korea Immigration Service Statistical Yearbooks and MOIS resident-registration population (summary_by_sido.csv).
Table 3Districts with the highest share of registered foreigners, 2024
| District | Province | Registered foreigners | Resident population | Foreign share (%) |
|---|---|---|---|---|
| Yeongam-gun | Jeollanam-do | 9,673 | 51,391 | 18.8 |
| Eumseong-gun | Chungcheongbuk-do | 13,808 | 91,236 | 15.1 |
| Ansan-si Danwon-gu | Gyeonggi-do | 38,321 | 293,388 | 13.1 |
| Pocheon-si | Gyeonggi-do | 16,317 | 141,463 | 11.5 |
| Wando-gun | Jeollanam-do | 5,110 | 45,631 | 11.2 |
| Jincheon-gun | Chungcheongbuk-do | 8,419 | 86,537 | 9.7 |
| Jindo-gun | Jeollanam-do | 2,612 | 28,478 | 9.2 |
| Seoul Jung-gu | Seoul | 10,670 | 120,544 | 8.8 |
| Seoul Jongno-gu | Seoul | 11,272 | 138,336 | 8.2 |
| Siheung-si | Gyeonggi-do | 40,493 | 518,132 | 7.8 |
Note: Foreign share is registered foreigners divided by the Korean resident-registration population of the district.
Source: KIRD dataset, built from MOJ Korea Immigration Service Statistical Yearbooks and MOIS resident-registration population (summary_by_sigungu.csv).
Dashboard: Foreign residents by province and district; National map
Sources: Ministry of Justice (MOJ), Korea Immigration Service Statistical Yearbooks (출입국·외국인정책 통계연보), 2006-2025 editions (link); Korea Immigration Regional Dashboard (KIRD). (2026). Spatiotemporal administrative dataset of nationality, residential diversity, and language demand among immigrants in South Korea, 2006-2024 [Data set]. Ann Arbor, MI: openICPSR (link)
Segregation and diversity
How segregated and how diverse are the places foreign residents live?
The KIRD dataset publishes several residential measures computed on registered foreigners by district. Nationality diversity (the Shannon index over the 19 largest nationalities plus a residual) rose nationally from 2.14 in 2009 to 2.60 in 2024, and the concentration index (HHI, the chance that two registered foreigners picked at random share a nationality, counting the nationalities outside the 19 largest as one group) fell from 0.214 to 0.100. The multigroup Theil index, which measures how unevenly Koreans and each nationality are spread across districts (0 means every district has the national mix), barely moved: 0.081 in 2009 and 0.081 in 2024.
The index of dissimilarity (D) gives the share of a group that would have to move for its district distribution to match that of Koreans. Among nationalities with at least 20,000 registered residents in 2024, D was lowest for Japan (0.26) and Vietnam (0.30) and highest for Kazakhstan (0.59), Sri Lanka (0.54) and Bangladesh (0.52). The Korean-Chinese value was 0.52.
The dataset flags an ethnic enclave where one nationality is at least twice as concentrated in a district as in the country (location quotient of 2 or more) and makes up at least 30 percent of the district's foreign residents. In 2024 there were 54 such district-nationality pairs: 21 Vietnamese, 15 Korean-Chinese and 10 Chinese, among others. The largest was the Korean-Chinese population of Siheung-si (17,727, 43.8 percent of the district's foreign residents).
Dashboard: National map; Foreign residents by province and district
Sources: Korea Immigration Regional Dashboard (KIRD). (2026). Spatiotemporal administrative dataset of nationality, residential diversity, and language demand among immigrants in South Korea, 2006-2024 [Data set]. Ann Arbor, MI: openICPSR (link); KIRD dashboard, Immigrants in Korea Today (link)
Visas and Reasons for Migration
Visa categories
What visas do foreign residents hold?
The yearbook reports 38 statuses of stay in 2024, each with a letter-number code. Grouped by purpose, employment statuses covered 19.2 percent of resident foreigners in 2024, the overseas-Korean statuses F-4 and H-2 covered 24.5 percent, short-term visits 19.7 percent, study and training 10.2 percent, marriage and family statuses 13.6 percent, and permanent residence (F-5) 7.7 percent. Diplomatic, humanitarian, miscellaneous (G-1) and other statuses made up the remaining 5.2 percent.
The largest single status was F-4 (overseas Korean), held by 555,968 people, followed by E-9 non-professional employment (337,279), B-1 visa exemption (206,546), F-5 permanent residence (202,968), D-2 study (178,519), C-3 short-term visit (162,719), B-2 tourist transit (153,101) and F-6 marriage migration (148,376).
Since 2014 the overseas-Korean share has fallen from 31.8 to 24.5 percent, with H-2 falling from 282,670 to 93,302 while the total grew, and study and training rose from 5.2 to 10.2 percent.
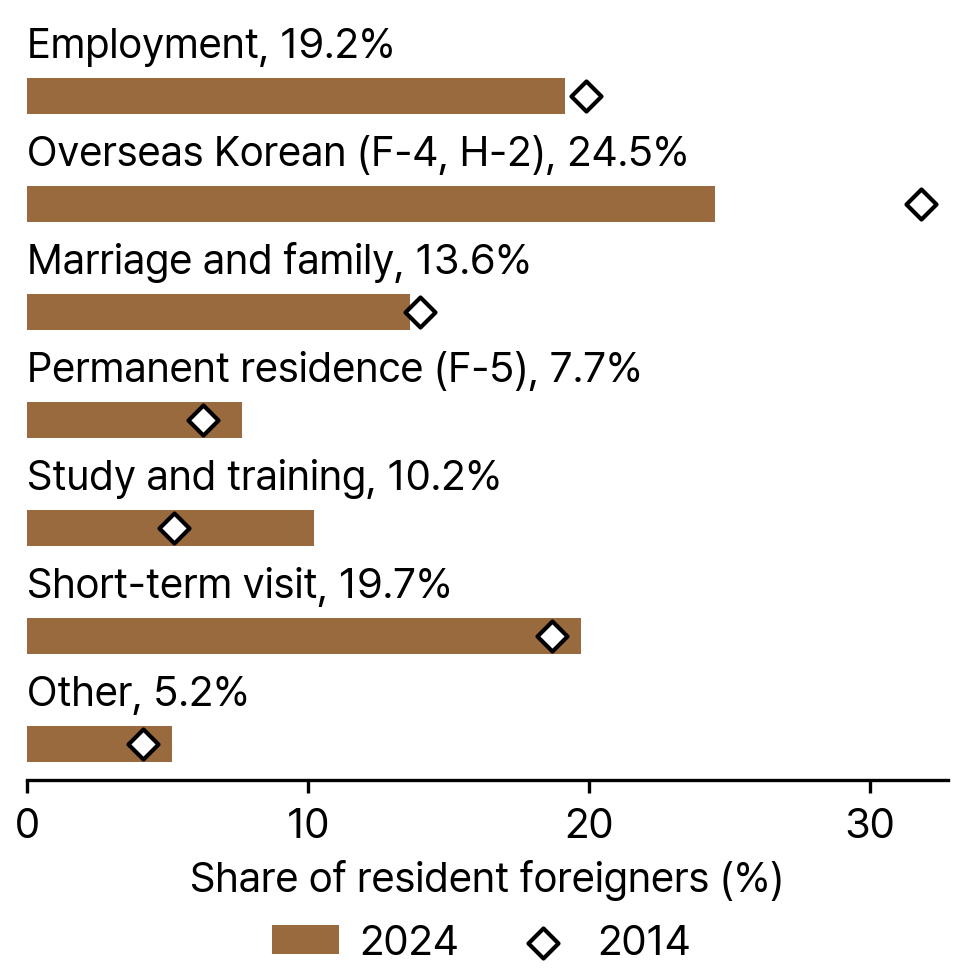
Source: KIRD dataset, built from MOJ Korea Immigration Service Statistical Yearbooks (visa_by_nationality.csv, population = stay). Employment: E-1 to E-10, C-4, H-1, D-7 to D-10. Marriage and family: F-1, F-2, F-3, F-6. Study and training: D-1 to D-6. Short-term visit: B-1, B-2, C-1, C-3. Labels give the 2024 share.
Dashboard: Foreign residents by visa status
Sources: Ministry of Justice (MOJ), Korea Immigration Service Statistical Yearbooks (출입국·외국인정책 통계연보), 2006-2025 editions (link); Korea Immigration Regional Dashboard (KIRD). (2026). Spatiotemporal administrative dataset of nationality, residential diversity, and language demand among immigrants in South Korea, 2006-2024 [Data set]. Ann Arbor, MI: openICPSR (link)
Migrant workers
How many foreign residents come to Korea to work, and from where?
About 508,000 resident foreigners held an employment status in 2024 (507,638 exactly). The largest is E-9 non-professional employment, the status of the Employment Permit System, which admits workers from partner countries for manufacturing, agriculture, fishing, construction and some services. E-9 holders numbered 337,279 in 2024, up from 161,867 in 2006 and 276,755 in 2019. The largest sending countries were Cambodia (48,998), Nepal (47,108), Vietnam (41,547), Indonesia (40,758), Myanmar (32,667).
H-2 (visiting employment) is reserved for ethnic Koreans from China and the former Soviet Union. It peaked at 306,283 in 2009 and has declined since while F-4 grew, falling to 93,302 in 2024; 79,821 of them (85.6 percent) were Korean-Chinese.
E-7 (specially designated activities), the main skilled-worker status, grew 3.0-fold from 21,314 in 2019 to 63,580 in 2024; Vietnam (11,597), China (9,522) and Nepal (7,849) supplied the most. E-8 seasonal workers, hired by rural local governments for farm and fishery peak seasons, grew from 383 in 2021 to 24,530 in 2024, led by Vietnam (13,541), the Philippines (4,454) and Laos (3,183). Other employment statuses include E-10 crew employment (21,922) and E-2 foreign-language instruction (13,443).
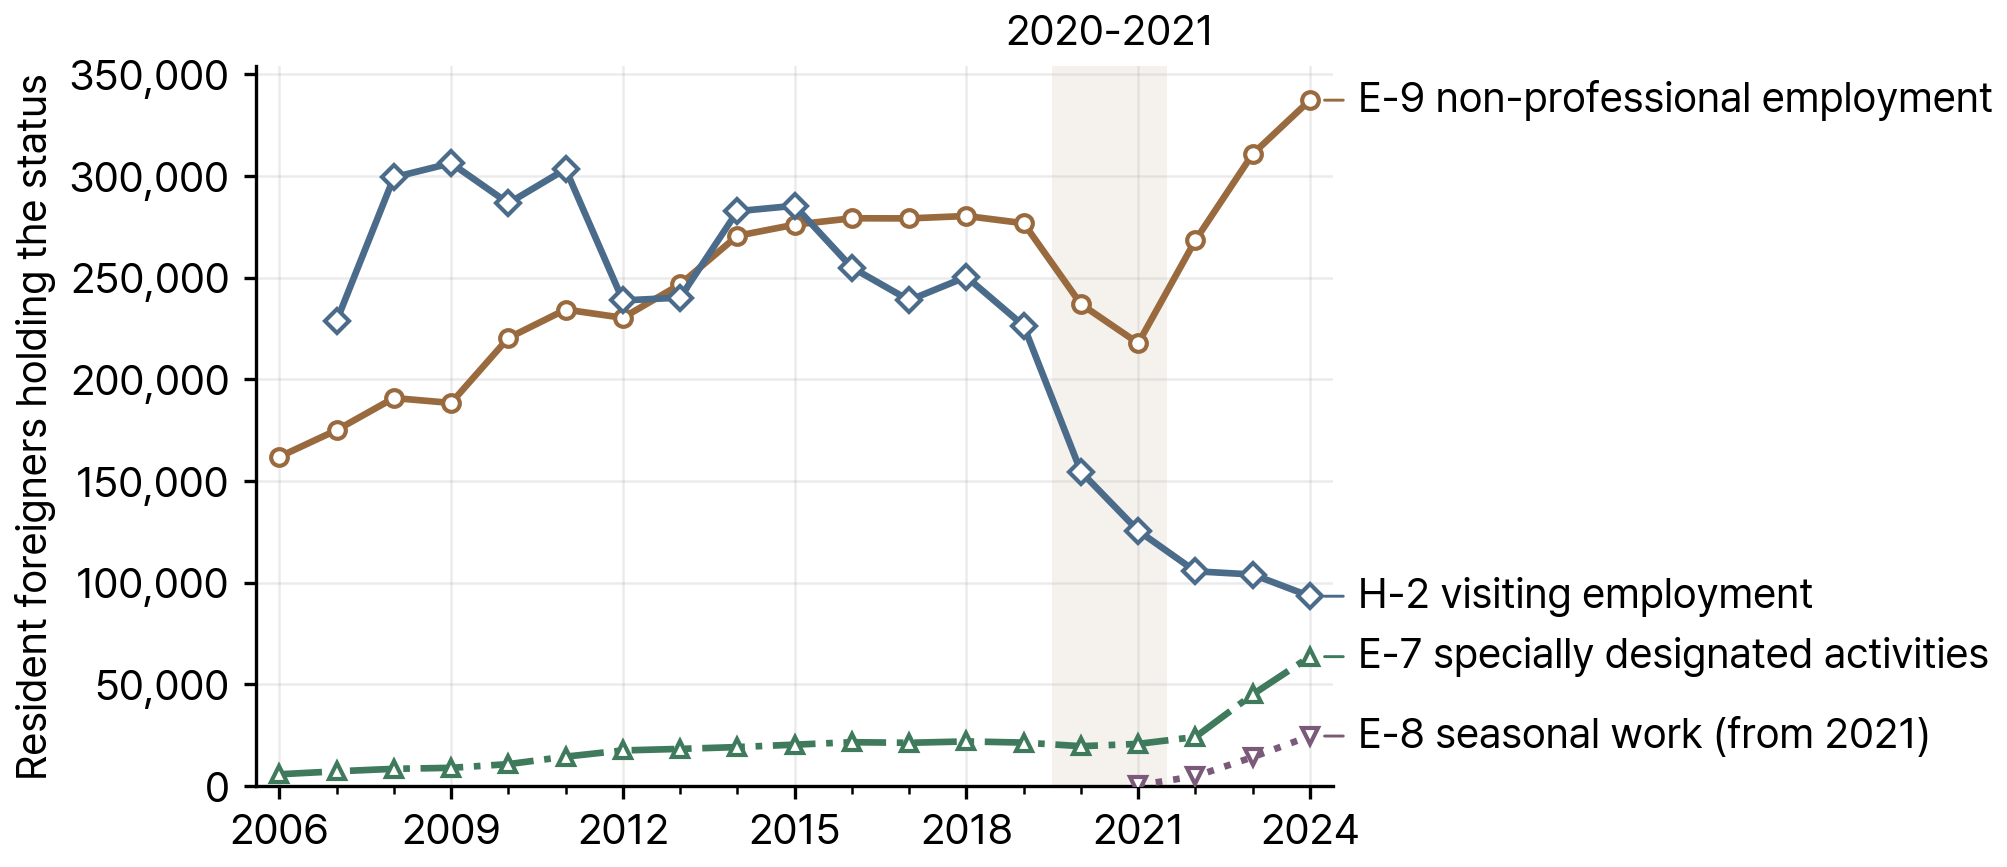
Source: KIRD dataset, built from MOJ Korea Immigration Service Statistical Yearbooks (visa_national.csv, population = stay). The H-2 series begins in 2007. The E-8 counts for 2006-2009 record the former training-employment status and are not shown.
Dashboard: Foreign residents by visa status
Sources: Ministry of Justice (MOJ), Korea Immigration Service Statistical Yearbooks (출입국·외국인정책 통계연보), 2006-2025 editions (link); Korea Immigration Regional Dashboard (KIRD). (2026). Spatiotemporal administrative dataset of nationality, residential diversity, and language demand among immigrants in South Korea, 2006-2024 [Data set]. Ann Arbor, MI: openICPSR (link)
Marriage migrants and multicultural households
How many marriage migrants and multicultural households are there?
The F-6 marriage-migration status for foreign spouses of Korean citizens, which first appears in the yearbook in 2011, was held by 148,376 resident foreigners in 2024, up from 86,944 in 2012. Vietnam accounted for the most F-6 holders (40,129), followed by China (26,174), the Korean-Chinese (15,916), the Philippines (12,029), Japan (9,553) and Thailand (9,157). In 2024, 21,450 marriages, 9.6 percent of all marriages in Korea, had at least one spouse who was a foreign national or a naturalized citizen.
Many marriage migrants later naturalize and leave the F-6 count. MOIS counts 191,839 marriage migrants without Korean nationality in 2024, up from 125,673 in 2009. It counts naturalized citizens separately (245,578 in 2024) without splitting them by route.
MOIS also counts the members of multicultural households, those formed by a marriage migrant or naturalized citizen with a Korean national or with each other. They numbered 1,239,448 in 2024, up from 963,174 in 2016, the first year in the released panel. By member type, the 2024 count included 418,316 marriage migrants and naturalized citizens, 167,602 Korean spouses, 312,665 children and 340,744 other household members. MOIS omits some small cells, so the member types sum to slightly less than the total.
Dashboard: Multicultural families
Sources: Ministry of Justice (MOJ), Korea Immigration Service Statistical Yearbooks (출입국·외국인정책 통계연보), 2006-2025 editions (link); Ministry of the Interior and Safety (MOIS), 2024 Local Government Foreign Resident Status (2024 지방자치단체 외국인주민 현황), reference date 1 November 2024 (link); Ministry of Data and Statistics, 2024 Multicultural Vital Statistics (2024년 다문화 인구동태 통계), released 6 November 2025 (link); Korea Immigration Regional Dashboard (KIRD). (2026). Spatiotemporal administrative dataset of nationality, residential diversity, and language demand among immigrants in South Korea, 2006-2024 [Data set]. Ann Arbor, MI: openICPSR (link)
International students
How many international students are in Korea?
Degree students hold the D-2 status and language and other trainees the D-4 status. D-2 holders numbered 178,519 in 2024, up from 61,257 in 2014 and 30,101 in 2006. D-4 general trainees, a status that covers university Korean-language programs, numbered 87,887. Together the two statuses accounted for 266,406 people.
The number of D-2 students fell from 118,254 in 2019 to 101,810 in 2020 and has grown every year since. China sent the most degree students (67,852, 38.0 percent), followed by Vietnam (41,359), Uzbekistan (13,054), Mongolia (10,471) and Nepal (8,867). Vietnam accounted for 55,983 of the D-4 trainees (63.7 percent).
MOIS counted 233,237 international students on 1 November 2024; 72,261 of them (31.0 percent) lived in Seoul. A further 18,226 people held the D-10 job-seeker status, a status open to graduates looking for work.
Dashboard: International students by university
Sources: Ministry of Justice (MOJ), Korea Immigration Service Statistical Yearbooks (출입국·외국인정책 통계연보), 2006-2025 editions (link); Ministry of the Interior and Safety (MOIS), 2024 Local Government Foreign Resident Status (2024 지방자치단체 외국인주민 현황), reference date 1 November 2024 (link); Korea Immigration Regional Dashboard (KIRD). (2026). Spatiotemporal administrative dataset of nationality, residential diversity, and language demand among immigrants in South Korea, 2006-2024 [Data set]. Ann Arbor, MI: openICPSR (link)
Overseas Koreans
How many overseas Koreans (ethnic Koreans with foreign nationality) live in Korea?
Ethnic Koreans with foreign nationality (재외동포, overseas Koreans) are the largest group of foreign residents. The F-4 overseas-Korean status, which comes with broad work rights, was held by 555,968 people in 2024, up from 289,427 in 2014 and 29,574 in 2006, making it the most common status of stay. Most F-4 holders were Korean-Chinese (390,862); others came from the United States (51,177), ethnic Koreans with Russian nationality (33,555), Uzbekistan (28,895), Canada (17,757) and Kazakhstan (14,501).
F-4 holders file a residence report (거소신고) under the Overseas Koreans Act instead of registering as foreigners, so they are missing from the registered count and from every district-level visa table. The 553,664 residence reports on file in 2024 are published by province only; Gyeonggi-do (239,460) and Seoul (147,773) held the most.
Across all statuses, 643,277 Korean-Chinese residents lived in Korea in 2024: 390,862 on F-4, 130,004 on F-5 permanent residence and 79,821 on H-2 visiting employment. Korean-Chinese residents held 64.1 percent of all F-5 permanent-residence statuses. The Korean-Russian population numbered 35,984. MOIS, which uses a survey definition, counted 415,695 ethnic Koreans of foreign nationality.
Dashboard: Overseas Korean residence reports
Sources: Ministry of Justice (MOJ), Korea Immigration Service Statistical Yearbooks (출입국·외국인정책 통계연보), 2006-2025 editions (link); Ministry of the Interior and Safety (MOIS), 2024 Local Government Foreign Resident Status (2024 지방자치단체 외국인주민 현황), reference date 1 November 2024 (link); Korea Immigration Regional Dashboard (KIRD). (2026). Spatiotemporal administrative dataset of nationality, residential diversity, and language demand among immigrants in South Korea, 2006-2024 [Data set]. Ann Arbor, MI: openICPSR (link)
Age, Sex and Children
Age and sex
What are the age and sex of foreign residents?
Men outnumber women among foreign residents. Of the 2,650,783 resident foreigners in 2024, 1,195,623 (45.1 percent) were women, about the same as in 2014 (44.7 percent) and below the 50.2 percent of Korean nationals on the resident register. The balance differs by nationality: women were 45.4 percent of Filipino residents and 69.5 percent of Japanese residents, but 18.1 percent of Nepali residents, 63.1 percent of whom held E-9 work status.
The population is young. People aged 20 to 39 made up 49.7 percent of resident foreigners in 2024, twice the 24.6 percent of Korean nationals, and the largest five-year band was 30-34. Children under 15 were 5.7 percent, against 10.7 percent of Korean nationals. Those aged 60 and older numbered 340,904 (12.9 percent, against 8.6 percent in 2014 and 28.2 percent of Korean nationals), and 65.8 percent of them were Korean-Chinese.
These figures count all resident foreigners, a series the yearbook publishes by nationality and age from 2011. The same file also includes registered foreigners alone from 2006; the two are different populations and are not compared here.
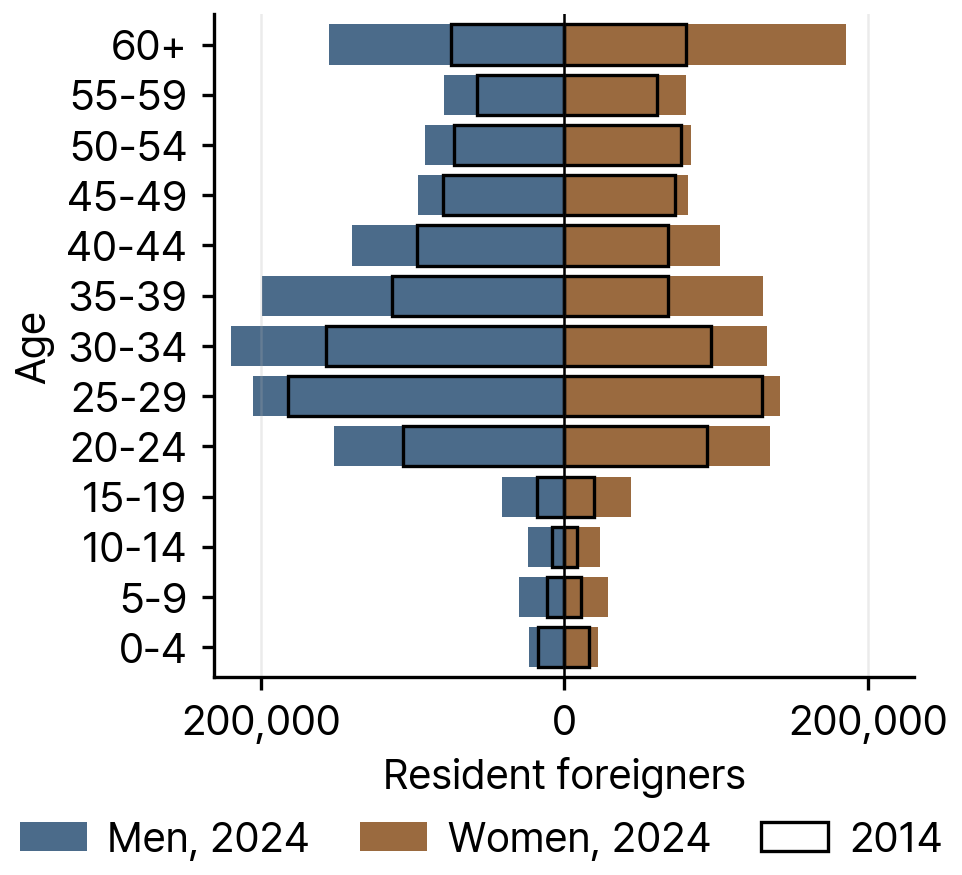
Source: KIRD dataset, built from MOJ Korea Immigration Service Statistical Yearbooks (age_sex_national.csv). Both years are on the resident-foreigner basis.
Dashboard: National statistics
Sources: Ministry of Justice (MOJ), Korea Immigration Service Statistical Yearbooks (출입국·외국인정책 통계연보), 2006-2025 editions (link); Ministry of the Interior and Safety (MOIS), Resident Registration Population Statistics (주민등록 인구통계), population by age and sex, December 2024 (link); Korea Immigration Regional Dashboard (KIRD). (2026). Spatiotemporal administrative dataset of nationality, residential diversity, and language demand among immigrants in South Korea, 2006-2024 [Data set]. Ann Arbor, MI: openICPSR (link)
Children of migrant background
How many children of migrant background live in Korea?
MOIS counted 315,383 children aged 0 to 18 in foreign-resident and multicultural families in 2024, 54.4 percent more than the 204,204 counted in 2014. By age, 102,372 were 0 to 6 years old, 108,870 were of elementary-school age (7 to 12) and 104,141 were 13 to 18. In 2024, 13,416 babies, 5.6 percent of all births in Korea, had at least one parent who was a foreign national or a naturalized citizen.
Gyeonggi-do held 88,008 of these children (27.9 percent). The children column of the MOIS summary tables (295,304 in 2024) is smaller because it counts children born in Korea only. Among the members of multicultural households, 292,720 children were born in Korea and 19,922 were naturalized or held foreign nationality.
Children who are themselves foreign nationals are counted by MOJ: 236,560 resident foreigners were under 20 in 2024.
Dashboard: Multicultural families
Sources: Ministry of the Interior and Safety (MOIS), 2024 Local Government Foreign Resident Status (2024 지방자치단체 외국인주민 현황), reference date 1 November 2024 (link); Ministry of Justice (MOJ), Korea Immigration Service Statistical Yearbooks (출입국·외국인정책 통계연보), 2006-2025 editions (link); Ministry of Data and Statistics, 2024 Multicultural Vital Statistics (2024년 다문화 인구동태 통계), released 6 November 2025 (link); Korea Immigration Regional Dashboard (KIRD). (2026). Spatiotemporal administrative dataset of nationality, residential diversity, and language demand among immigrants in South Korea, 2006-2024 [Data set]. Ann Arbor, MI: openICPSR (link)
Education, Work and Health Insurance
Educational attainment
What level of education do foreign residents have?
In May 2025, 522,000 (30.9 percent) of the estimated 1,692,000 foreign residents aged 15 and over had graduated from a junior college or university, 729,000 (43.1 percent) from high school and 299,000 (17.7 percent) from middle school, and 142,000 (8.4 percent) had elementary schooling or less. In the population as a whole, the same shares were 43.6, 36.2, 10.6 and 9.6 percent.
The employment rate of foreign residents with a junior college or university degree was 65.8 percent, below the 77.0 percent of all degree holders, while that of foreign residents with elementary schooling or less was 55.3 percent, against 36.7 percent. Among high school graduates the two rates were 65.4 and 62.8 percent, and among middle school graduates 70.4 and 36.9 percent.
These figures, and those on work and wages below, come from the Survey on Immigrants' Living Conditions and Labour Force, which the Ministry of Data and Statistics (국가데이터처, formerly Statistics Korea) and MOJ have conducted every year since 2017; the MOJ and MOIS counts used elsewhere on this page do not include schooling. The survey covers registered foreigners and overseas Koreans with residence reports who are aged 15 and over and have lived in Korea for 91 days or more, so short-term visitors are outside its scope. It sampled 20,000 of them in 2025 and publishes counts in thousands, from which the shares here are computed. The comparison figures come from the Economically Active Population Survey of the same month, which covers everyone aged 15 and over in its sample households and has included foreign residents since 2009, so they describe the population as a whole.
Sources: Ministry of Data and Statistics (국가데이터처, formerly Statistics Korea) and MOJ, 2025 Survey on Immigrants' Living Conditions and Labour Force (2025년 이민자체류실태및고용조사), released 18 December 2025 (link); Ministry of Data and Statistics, Economically Active Population Survey, economically active population by educational attainment (교육정도별 경제활동인구), May 2025, KOSIS (link)
Employment and industries
How many foreign residents work, and in which industries?
In May 2025 an estimated 1,109,000 foreign residents aged 15 and over were employed, up from 1,010,000 a year earlier. Their employment rate was 65.5 percent, against 63.8 percent for the population as a whole in the Economically Active Population Survey of the same month; their labor force participation rate was 70.0 percent (65.6 percent for the whole population) and their unemployment rate 6.4 percent (2.8 percent). Holders of E-9 non-professional employment status were the largest group of workers (321,000), followed by F-4 overseas Koreans (253,000) and F-5 permanent residents (123,000).
Mining and manufacturing employed 498,000 foreign residents (44.9 percent of the employed), followed by wholesale and retail trade, accommodation and food (226,000, 20.4 percent); business, personal and public services (148,000, 13.3 percent); construction (107,000, 9.6 percent); and agriculture, forestry and fishing (100,000, 9.0 percent). In the workforce as a whole the shares were 15.2 percent in mining and manufacturing, 19.1 percent in wholesale and retail trade, accommodation and food, 6.7 percent in construction and 5.1 percent in agriculture, forestry and fishing. Over the year, employment of foreign residents rose by 37,000 in mining and manufacturing and by 35,000 in wholesale and retail trade, accommodation and food.
Wage workers numbered 1,047,000, or 94.4 percent of the employed, against 77.5 percent of the workforce as a whole. Of them, 684,000 (65.3 percent) were regular employees and 363,000 temporary or daily workers; among all wage workers the regular share was 74.1 percent. Establishments with 10 to 29 workers employed the most foreign residents (295,000), followed by those with four or fewer (264,000).
Sources: Ministry of Data and Statistics (국가데이터처, formerly Statistics Korea) and MOJ, 2025 Survey on Immigrants' Living Conditions and Labour Force (2025년 이민자체류실태및고용조사), released 18 December 2025 (link); Ministry of Data and Statistics, Economically Active Population Survey: Employment Trends, May 2025 (2025년 5월 고용동향), released 11 June 2025 (link)
Wages
How much do foreign wage workers earn?
In May 2025, 526,000 of the 1,047,000 foreign wage workers (50.2 percent) earned an average of 2 million to under 3 million won a month and 387,000 (36.9 percent) earned 3 million won or more; 95,000 (9.0 percent) earned 1 million to under 2 million won and 40,000 (3.8 percent) less than 1 million won. The immigrant survey publishes no finer wage breakdown. Every band grew in number over the year, and no band's share changed by more than one percentage point.
Compared with all wage workers in the Local Area Labour Force Survey of April 2025, foreign wage workers were more often in the band from 2 million to under 3 million won (50.2 percent against 30.6 percent) and less often at 3 million won or more (36.9 against 49.9 percent) or below 2 million won (12.8 against 19.5 percent).
Among male wage workers, 43.8 percent earned 3 million won or more, against 22.0 percent of women; 25.9 percent of women earned less than 2 million won, against 6.9 percent of men.
By status of stay, 98,000 of the 321,000 E-9 workers (30.5 percent) earned 3 million won or more and 221,000 (68.8 percent) 2 million to under 3 million won. Among professionals on E-1 to E-7 status, 41,000 of 81,000 (50.6 percent) earned 3 million won or more. International students who worked were concentrated in the lowest bands: 20,000 of 55,000 (36.4 percent) earned less than 1 million won and 28,000 (50.9 percent) 1 million to under 2 million won.
Table 4Monthly wages of foreign wage workers, May 2024 and May 2025, and of all wage workers, April 2025
| Group | Wage workers | Under 1 million won (%) | 1 to under 2 million won (%) | 2 to under 3 million won (%) | 3 million won or more (%) |
|---|---|---|---|---|---|
| All, 2024 | 956,000 | 3.3 | 8.4 | 51.2 | 37.1 |
| All, 2025 | 1,047,000 | 3.8 | 9.0 | 50.2 | 36.9 |
| Men, 2025 | 720,000 | 2.1 | 4.8 | 49.3 | 43.8 |
| Women, 2025 | 327,000 | 7.6 | 18.3 | 52.2 | 22.0 |
| All wage workers, 2025 | 22,415,000 | 9.6 | 9.9 | 30.6 | 49.9 |
Note: Wage workers are regular, temporary and daily employees; the self-employed and unpaid family workers are excluded. The immigrant survey publishes counts in thousands. The last row covers all wage workers in the Local Area Labour Force Survey of April 2025, whose bands from 3 million won up (3 to 4 million, 4 to 5 million, 5 million or more) are summed here.
Source: Ministry of Data and Statistics and MOJ, 2025 Survey on Immigrants' Living Conditions and Labour Force, statistical table 7-가 (monthly wage level); Ministry of Data and Statistics, Local Area Labour Force Survey, first half of 2025.
Sources: Ministry of Data and Statistics (국가데이터처, formerly Statistics Korea) and MOJ, 2025 Survey on Immigrants' Living Conditions and Labour Force (2025년 이민자체류실태및고용조사), released 18 December 2025 (link); Ministry of Data and Statistics, Local Area Labour Force Survey, first half of 2025: industry and occupation of the employed (2025년 상반기 지역별고용조사 취업자의 산업 및 직업별 특성), released 28 October 2025 (link)
National Health Insurance
How many foreign residents have national health insurance, and how do their premiums compare with the benefits paid?
At the end of 2024, 1,578,546 foreign nationals were covered by National Health Insurance, according to the 2024 National Health Insurance Statistical Yearbook of the National Health Insurance Service (NHIS) and the Health Insurance Review and Assessment Service. Of these, 647,924 were workplace subscribers (employees and employers insured through a workplace) and 195,201 their dependents, who pay no premium. The other 735,421 were regional subscribers, the category for everyone not covered through a workplace, in 605,781 households. The yearbook counts registered foreigners and ethnic Koreans with foreign nationality who filed a residence report, and lists Korean nationals living abroad (28,272) separately.
Foreign nationals were 3.1 percent of the 51,439,246 people covered. Compared with Korean nationals, a smaller share were insured through a workplace, as subscribers or dependents (53.4 percent against 70.1 percent), and a smaller share were dependents (12.4 percent against 31.5 percent). The Korean-national shares subtract the foreign counts from the yearbook's national totals.
NHIS also publishes the premiums it levies on foreign nationals and the benefits it pays for them. In 2025 it levied 2.51 trillion won in premiums, 1.83 trillion won from workplace subscribers and 683.2 billion won from regional subscribers, and paid 1.52 trillion won in benefits, so premiums levied exceeded benefits by 989.1 billion won. The gap was 512.5 billion won in 2021 and has widened every year since. For every 100 won of premiums levied on foreign nationals in 2025, NHIS paid 60.6 won in benefits. The file reports benefits for Korean nationals through 2023 only; that year NHIS paid 106.5 won in benefits per 100 won of premiums levied on Korean nationals (82.08 trillion won against 77.09 trillion won), and 63.5 won per 100 won for foreign nationals.
The release breaks the figures down for ten nationalities and lists China as one nationality, without the MOJ split between the Korean-Chinese and other Chinese nationals. NHIS levied 947.7 billion won on Chinese nationals in 2025 and paid 997.3 billion won in benefits for them. Premiums exceeded benefits for each of the other nine nationalities, including Vietnam (238.4 billion won against 78.5 billion won) and Nepal (147.2 billion won against 21.0 billion won).
Sources: National Health Insurance Service (NHIS) and Health Insurance Review and Assessment Service, 2024 National Health Insurance Statistical Yearbook (2024 건강보험통계연보), tables I-2 and I-8, published November 2025 (link); NHIS, Premiums levied and benefits paid for Korean and foreign nationals (내외국인 건강보험료 부과 및 급여 현황), 2019-2025, Public Data Portal, posted 17 September 2026 (link)
Citizenship, Legal Status and Asylum
Naturalization
How many foreign residents become Korean citizens each year?
In 2024, 11,008 foreign nationals naturalized as Korean citizens, and a further 3,607 former Korean nationals had their nationality restored. Annual naturalizations ranged between 9,914 (2019) and 16,090 (2011) from 2011 to 2024, and totaled 158,184 over those 14 years. The stock of naturalized citizens counted by MOIS was 245,578 in 2024.
Simplified naturalization, the route open to spouses of Korean citizens among others, accounted for 5,858 of 2024 naturalizations; general naturalization for 2,095, special naturalization for 1,673 and acquisition by family members for 1,382.
The Korean-Chinese (4,334), Vietnamese (2,951) and other Chinese nationals (1,915) made up 83.6 percent of new citizens in 2024. Over 2015-2024, Vietnam was the leading former nationality (37,959), ahead of the Korean-Chinese (32,118), China (17,347), Cambodia (3,484) and the Philippines (3,342).
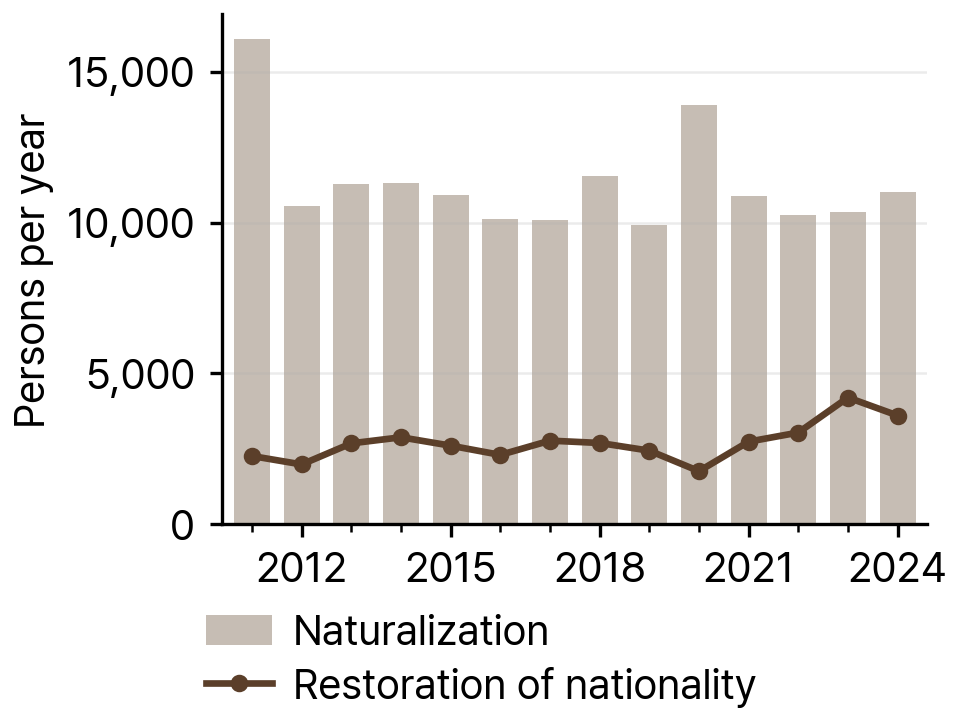
Source: KIRD dataset, built from MOJ Korea Immigration Service Statistical Yearbooks (naturalization_annual.csv).
Dashboard: Nationality acquisition
Sources: Ministry of Justice (MOJ), Korea Immigration Service Statistical Yearbooks (출입국·외국인정책 통계연보), 2006-2025 editions (link); Ministry of the Interior and Safety (MOIS), 2024 Local Government Foreign Resident Status (2024 지방자치단체 외국인주민 현황), reference date 1 November 2024 (link); Korea Immigration Regional Dashboard (KIRD). (2026). Spatiotemporal administrative dataset of nationality, residential diversity, and language demand among immigrants in South Korea, 2006-2024 [Data set]. Ann Arbor, MI: openICPSR (link)
Unauthorized residents
How many foreign residents are in Korea without legal status?
MOJ counted 357,598 foreign nationals without a valid status of stay (미등록 체류자, which the yearbook calls 불법체류자) at the end of 2025, down from a peak of 423,675 in 2023. The count was 208,778 in 2014, 208,971 in 2016 and 355,126 in 2018. In 2024 it stood at 397,522, or 15.0 percent of the 2,650,783 resident foreigners that year.
The yearbook records the status on which each person entered or last held. In 2025, 125,925 (35.2 percent) had entered on B-1 visa exemption, 72,910 on C-3 short-term visit visas, and 50,499 had last held E-9 work status. Men were 227,113 (63.5 percent). In all, 188,215 (52.6 percent) had overstayed for more than five years, and 49,962 for more than ten.
The yearbook names only the ten largest nationalities. Thailand led in 2025 with 115,851 (32.4 percent), followed by Vietnam (72,979) and China (56,551). The 137,035 unauthorized Thai nationals in 2024 equaled 72.6 percent of all Thai resident foreigners that year. A separate yearbook table counts only people who had registered and later lost status: 128,813 of 1,604,920 registered foreigners (8.0 percent) in 2025. No district figures exist.
Table 5Unauthorized residents by nationality, 2024 and 2025
| Rank (2025) | Nationality | 2025 | 2024 | 2024 as % of that nationality's resident foreigners |
|---|---|---|---|---|
| 1 | Thailand | 115,851 | 137,035 | 72.6 |
| 2 | Vietnam | 72,979 | 77,730 | 25.4 |
| 3 | China | 56,551 | 61,906 | 19.6 |
| 4 | Mongolia | 14,681 | 16,554 | 29.0 |
| 5 | Philippines | 13,594 | 13,937 | 19.8 |
| 6 | Indonesia | 13,367 | 13,001 | 17.8 |
| 7 | Cambodia | 10,331 | 10,709 | 16.8 |
| 8 | Kazakhstan | 9,015 | 11,306 | 25.4 |
| 9 | Uzbekistan | 7,375 | 8,103 | 8.5 |
| 10 | Russia | 6,531 | 8,312 | 25.0 |
Note: The yearbook prints the ten largest nationalities and a residual row (37,323 in 2025). The last column divides the 2024 unauthorized count by the 2024 resident-foreigner count of the nationality; for China the denominator excludes the Korean-Chinese, whom the resident-foreigner tables list separately.
Source: MOJ Korea Immigration Service Statistical Yearbooks 2024 and 2025, chapter 6, table 6-4, as compiled in the KIRD dashboard (undocumented.json); denominators from the KIRD dataset.
Dashboard: Undocumented residence
Sources: Ministry of Justice (MOJ), Korea Immigration Service Statistical Yearbooks (출입국·외국인정책 통계연보), 2006-2025 editions (link); KIRD dashboard, Undocumented residence page (MOJ yearbook chapter 6) (link)
Immigration enforcement
How many foreign nationals are ordered to leave Korea each year?
MOJ processed 142,265 people for violations of the Immigration Control Act in 2025, up from 139,727 in 2024 and 98,350 in 2022. Its yearbook sorts them by the measure taken. Deportation orders (강제퇴거) numbered 33,892 (23.8 percent) and departure orders (출국명령) 43,361 (30.5 percent). Another 1,676 (1.2 percent) received a departure recommendation (출국권고) and 1,809 (1.3 percent) were referred for prosecution (고발). The remaining 61,527 (43.2 percent) received a fine notice (통고처분) followed by permission to remain or a similar measure.
Deportation orders more than tripled between 2022 (10,196) and 2023 (31,932), and departure orders rose from 28,585 to 40,538. Both fell slightly in 2025. The yearbook counts persons and does not break these figures down by nationality or type of violation.
Dashboard: Undocumented residence
Sources: MOJ, Korea Immigration Service Statistical Yearbook 2025 (2025년 출입국·외국인정책 통계연보), chapter 7, table 7-1, published 30 June 2026 (link); Ministry of Justice (MOJ), Korea Immigration Service Statistical Yearbooks (출입국·외국인정책 통계연보), 2006-2025 editions (link)
Refugees and asylum
How many people seek asylum in Korea, and how many are recognized?
Korea received 14,626 refugee applications in 2025. Applications rose from 1,574 in 2013 to 16,173 in 2018, fell to 2,341 in 2021 during pandemic border controls, and rose to a high of 18,837 in 2023. Since 1994, when the country began accepting applications, the cumulative total is 136,720.
Few applicants receive protection. Through 2025, 1,679 people had been recognized as refugees and 2,727 granted humanitarian stay, a status that permits residence and work. At first instance in 2025, the ministry recognized 112 of 7,404 decisions (1.5 percent) and granted humanitarian stay in 18. Counting appeals and court rulings, the recognition rate on final decisions was 1.9 percent in 2024 (105 of 5,610) and 2.7 percent over 1994-2024.
Russia (20,283), Kazakhstan (14,295) and China (11,695) accounted for the most applications over 1994-2025, and 74.1 percent of applicants were men. Recognized refugees came most often from Myanmar (550), Egypt (179) and Ethiopia (170); family reunification accounted for 39.4 percent of recognitions. Syrians (1,272) and Yemenis (804) received most humanitarian stay permits.
At the end of 2025, 29,078 applications awaited a first-instance decision and 10,030 appeals awaited review by the Refugee Committee; at the end of August 2026 the counts were 29,091 and 12,323. First-instance decisions made in 2025 came 18 months after the application on average, against 12 months for decisions made in 2023 and 14 in 2024, and 2,963 of the 7,404 (40.0 percent) came two years or more after it. MOJ puts the average at about 17 months for appeals and about 22 months for court cases against a rejection.
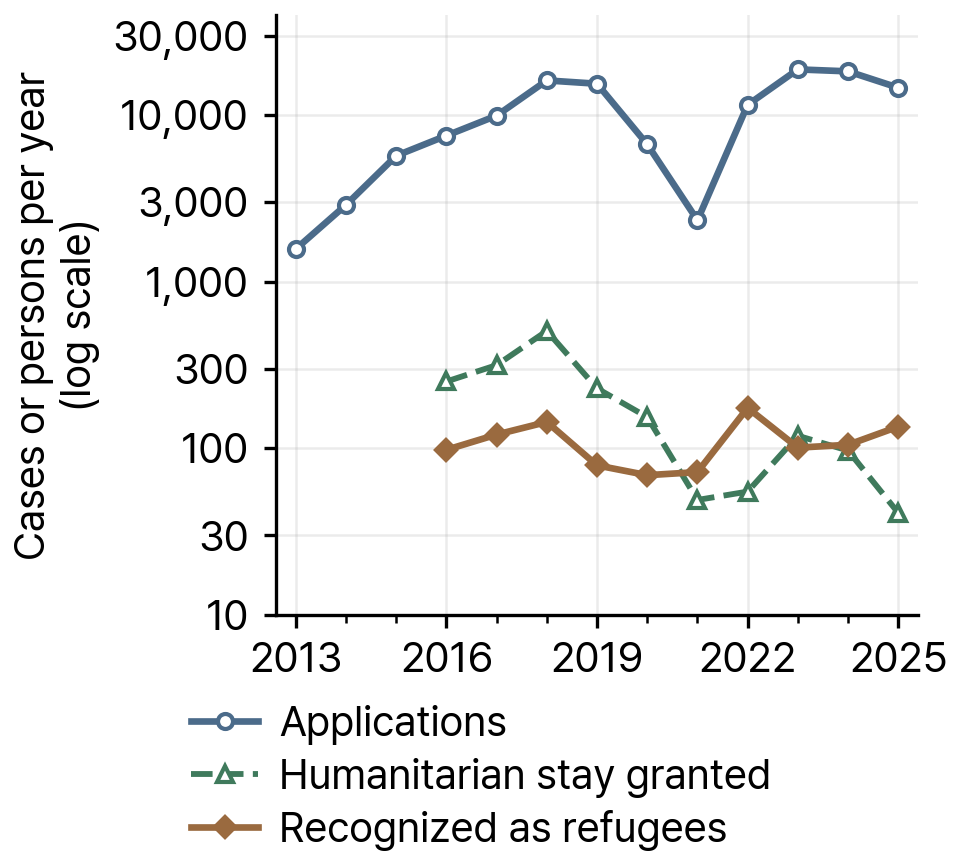
Source: MOJ Refugee Policy Division, Consolidated Refugee Statistics 1994-2025, with applications for 2013-2015 from Refugee Application and Review Statistics 1994-2024, as compiled in the KIRD dashboard (h_refugee_moj.json, yearly series). Recognitions and humanitarian permits are counted by year of decision across all review stages.
Dashboard: Refugees
Sources: MOJ Refugee Policy Division, Consolidated Refugee Statistics 1994-2025 and Refugee Application and Review Statistics 1994-2024, posted on the MOJ statistics board (link); MOJ, Monthly Immigration and Foreign Policy Statistics, August 2026 (2026년 8월 출입국외국인정책 통계월보), posted 22 September 2026 (link); KIRD dashboard, Refugees page (link)
Languages and Services
Languages
What languages do foreign residents speak?
No Korean statistic records the languages foreign residents speak. The KIRD dataset estimates first languages by splitting each nationality's count across the first-language (mother-tongue) speaker shares of its country of origin from Ethnologue (24th edition), then summing across nationalities. Korean is excluded, so Korean-Chinese and other ethnic Korean residents whose first language is Korean add nothing. The estimate describes likely interpretation and translation demand; it does not count requests for interpreters.
Applied to the 2024 resident-foreigner population, the method yields 2,006,764 estimated first-language speakers across 1,428 languages. Chinese (Mandarin) led with 349,584, followed by Vietnamese (262,973), English (189,919), Thai (163,893) and Russian (93,025). Vietnamese demand was 2.3 times its 2014 level.
At the district level, on the registered basis, Vietnamese was the largest estimated non-Korean first language in 146 of 250 districts in 2024, Chinese in 69 and Khmer in 13.
Table 6Estimated first languages of resident foreigners, 2014 and 2024
| Language | 2014 | 2024 | Share of estimated speakers, 2024 (%) |
|---|---|---|---|
| Chinese | 324,144 | 349,584 | 17.4 |
| Vietnamese | 112,314 | 262,973 | 13.1 |
| English | 149,261 | 189,919 | 9.5 |
| Thai | 81,549 | 163,893 | 8.2 |
| Russian | 21,733 | 93,025 | 4.6 |
| Uzbek | 31,923 | 71,135 | 3.5 |
| Khmer | 38,715 | 65,488 | 3.3 |
| Japanese | 48,501 | 64,424 | 3.2 |
| Tagalog/Filipino | 48,352 | 63,600 | 3.2 |
| Indonesian | 33,420 | 52,034 | 2.6 |
Note: Estimated values. Each nationality's resident foreigners are split by the first-language shares of its country of origin (Ethnologue, 24th edition). Korean is excluded.
Source: KIRD dataset, language_demand.csv, scope = national, built on MOJ resident-foreigner counts by nationality.
Dashboard: Estimated language demand
Sources: Korea Immigration Regional Dashboard (KIRD). (2026). Spatiotemporal administrative dataset of nationality, residential diversity, and language demand among immigrants in South Korea, 2006-2024 [Data set]. Ann Arbor, MI: openICPSR (link); KIRD dashboard, language demand pages (link)
Organizations serving migrants
How many organizations serve immigrants, and where are they?
There is no official register of organizations serving immigrants, so KIRD compiled one from ministry program rosters, local government lists and organizations' own websites. The census held 1,717 organizations as of 28 September 2026, 1,653 of which serve people directly. The largest types were sites running the MOJ social integration and early adaptation programs (538), civic and faith-based organizations (246), medical support institutions (192), family centers (151), migrant community organizations (116), foreign resident support centers (109) and migrant worker support centers (90).
By service, 919 organizations offered settlement and social integration support, 847 Korean language classes, 408 employment and labor-rights help, 376 interpretation and translation, 233 legal and immigration-status help, and 43 mental health counseling. The Ministry of Justice funds or designates 453 of the organizations, the gender-equality ministry 267 and the health and welfare ministry 149; 573 are privately funded.
The capital region held 44.3 percent of the organizations and 55.2 percent of registered foreigners. Measured per 10,000 registered foreigners in 2024, coverage was highest in Gwangju (41.0) and lowest in Gyeonggi-do (7.4) and Chungcheongnam-do (7.8); the national figure was 11.5. The census may miss organizations, so low values mark places to check.
Dashboard: Support organization list; Service gaps
Sources: KIRD dashboard, service map and organization list (link); KIRD dashboard, Immigrants in Korea Today (link)
Sources
Ministry of Justice (MOJ), Korea Immigration Service Statistical Yearbooks (출입국·외국인정책 통계연보), 2006-2025 editions https://www.immigration.go.kr/immigration/1570/subview.do
Ministry of the Interior and Safety (MOIS), 2024 Local Government Foreign Resident Status (2024 지방자치단체 외국인주민 현황), reference date 1 November 2024 https://www.mois.go.kr/frt/bbs/type001/commonSelectBoardArticle.do?bbsId=BBSMSTR_000000000014&nttId=121226
MOJ Refugee Policy Division, Consolidated Refugee Statistics 1994-2025 and Refugee Application and Review Statistics 1994-2024, posted on the MOJ statistics board https://www.immigration.go.kr/immigration/1570/subview.do
Ministry of Data and Statistics (국가데이터처, formerly Statistics Korea) and MOJ, 2025 Survey on Immigrants' Living Conditions and Labour Force (2025년 이민자체류실태및고용조사), released 18 December 2025 https://mods.go.kr/board.es?mid=a10301030400&bid=11109&act=view&list_no=442471
National Health Insurance Service (NHIS) and Health Insurance Review and Assessment Service, 2024 National Health Insurance Statistical Yearbook (2024 건강보험통계연보), tables I-2 and I-8, published November 2025 https://www.hira.or.kr/bbsDummy.do?pgmid=HIRAA020045010000&brdScnBltNo=4&brdBltNo=2431
Korea Immigration Regional Dashboard (KIRD). (2026). Spatiotemporal administrative dataset of nationality, residential diversity, and language demand among immigrants in South Korea, 2006-2024 [Data set]. Ann Arbor, MI: openICPSR https://doi.org/10.3886/E249944V1
KIRD dashboard, Immigrants in Korea Today https://immigrantsinkorea.today/
Suggested citation: Korea Immigration Regional Dashboard (KIRD). 2026. “Frequently Requested Statistics on Foreign Residents in South Korea.” Foreign Residents in South Korea series, September 2026. Data: Korea Immigration Regional Dashboard (KIRD) dataset, https://doi.org/10.3886/E249944V1. Interactive maps and tables: https://immigrantsinkorea.today.