 Korea Immigration Regional Dashboard
SpotlightSeptember 2026Nationality profilesDownload PDF
Chinese Immigrants in South Korea
Highlights
- In 2024, 315,682 Chinese nationals lived in South Korea. They were the third-largest nationality among registered foreigners (14.7 percent) and the second-largest among all resident foreigners (11.9 percent).
- The population peaked at 400,684 in 2019, fell to 225,528 in 2021, and in 2024 stood at 78.8 percent of its 2019 size, 19th in growth among the 20 largest nationalities.
- In 2024, 29.3 percent of Chinese residents held short-term visit status and 24.0 percent held study or training status, compared with 19.7 and 10.2 percent of all resident foreigners.
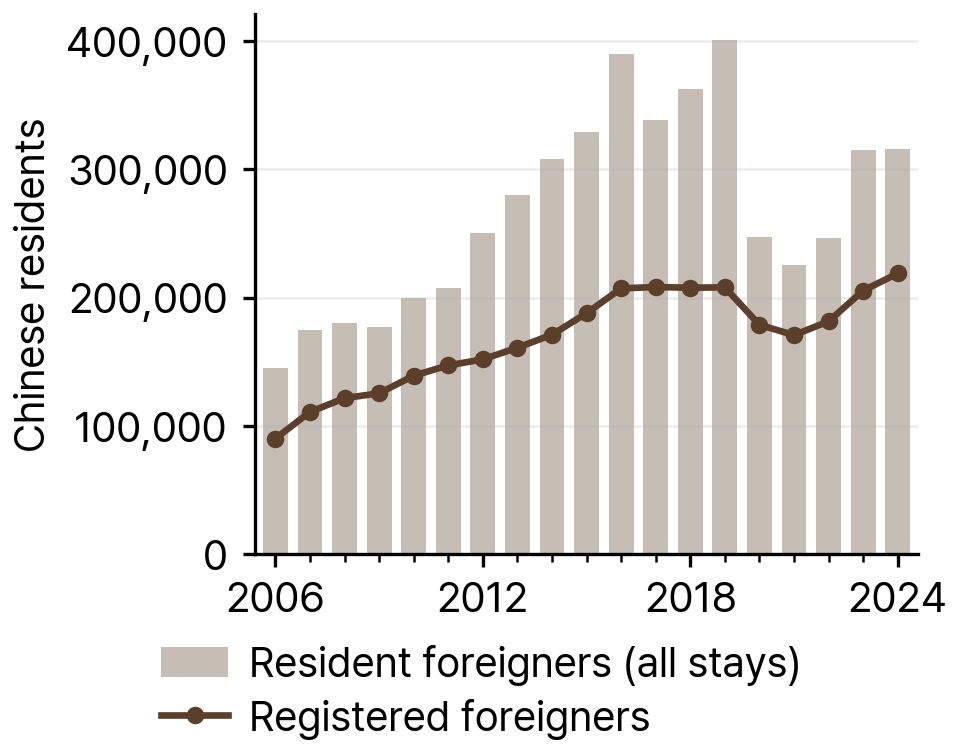
Chinese nationals were the third-largest nationality among registered foreigners in South Korea in 2024 and the second-largest among all resident foreigners. Of the 315,682 Chinese resident foreigners that year (11.9 percent of all resident foreigners), 218,893 (69.3 percent) were registered foreigners, equal to 14.7 percent of all registered foreigners. China ranked second on both bases in 2006, 2014, and 2019.
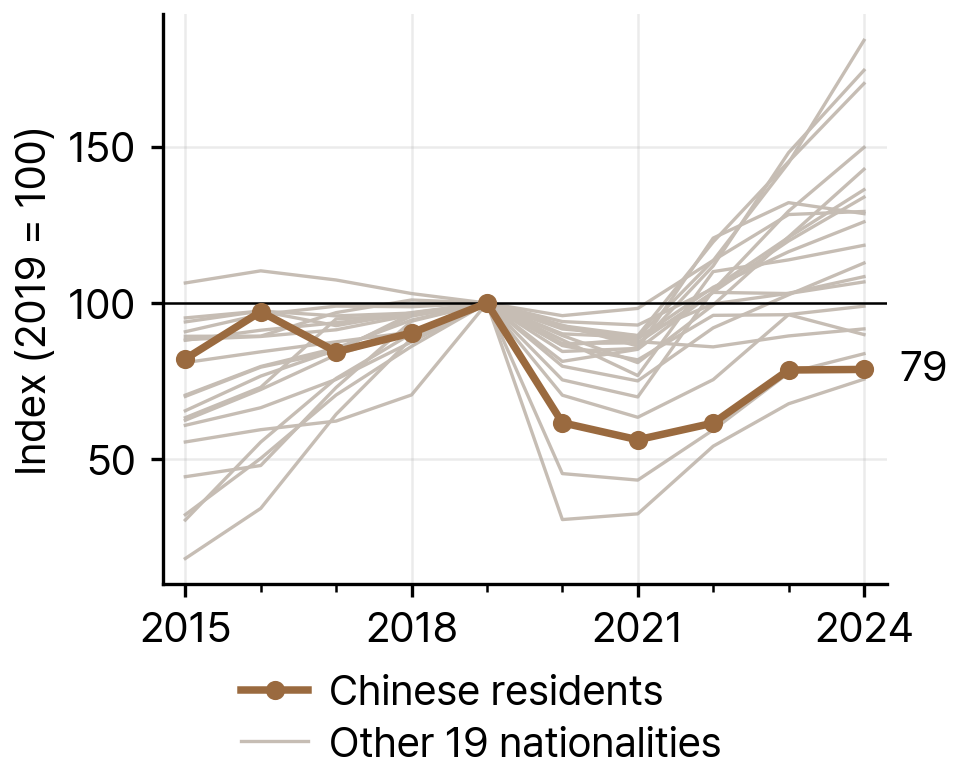
The population grew from 145,383 in 2006 to 400,684 in 2019, an increase of about 176 percent. It fell to 247,330 in 2020 and 225,528 in 2021, a period that included the suspension of visa-free entry to Jeju for Chinese nationals during COVID-19 (Headline Jeju, 2020). By 2024 it had recovered to 315,682, or 85,002 below the 2019 peak. Among the 20 largest nationalities, only one had a weaker change between 2019 and 2024.
Compared with all resident foreigners in 2024, Chinese residents were more often women (57.0 percent versus 45.1 percent), more often in study and training statuses (24.0 percent versus 10.2 percent), and more often in the Seoul capital region (66.0 percent versus 55.2 percent). Only 6.5 percent held employment visas, against 19.2 percent of all resident foreigners. This Spotlight describes the size, location, age, visa status, naturalization, and unauthorized population of Chinese residents, together with migration from China to South Korea and published research on their migration, health, and community institutions.
Size of the Population over Time
The number of Chinese resident foreigners rose from 145,383 in 2006 to 199,802 in 2010, 307,798 in 2014, and 400,684 in 2019. The count dropped by 153,354 between 2019 and 2020 and was lowest in 2021, at 225,528. It rose to 314,945 in 2023 and 315,682 in 2024.
Registered foreigners followed a steadier path. The registered count grew from 90,298 in 2006 to 208,081 in 2019 and 218,893 in 2024, so it was 10,812 higher in 2024 than in 2019 even though the resident total was 85,002 lower. Most of the decline after 2019 was among short-term visa holders: C-3 short-term visit holders fell from 143,617 to 70,013 and B-2 tourist and transit holders from 43,305 to 22,473 between 2019 and 2024. Among registered foreigners, China ranked second in 2006, 2014, and 2019 and third in 2024, and its share of all registered foreigners fell from 16.4 percent in 2019 to 14.7 percent in 2024. Among all resident foreigners it ranked second in each of those years, and its share fell from 16.0 percent in 2006 to 11.9 percent in 2024.
Source: KIRD dataset, from Ministry of Justice immigration yearbooks, 2006-2024.
Indexed to 2019 (2019 = 100), the Chinese population stood at 78.8 in 2024, which ranked 19th of the 20 largest nationalities.
Source: KIRD dataset, from Ministry of Justice immigration yearbooks, 2006-2024.
Table 1Chinese Resident and Registered Foreigners in South Korea, Selected Years, 2006-24
| Year | Resident foreigners | Registered foreigners | Rank among registered foreigners | Rank among all resident foreigners | Share of all registered foreigners (%) | Share of all resident foreigners (%) |
|---|---|---|---|---|---|---|
| 2006 | 145,383 | 90,298 | 2 | 2 | 14.3 | 16.0 |
| 2014 | 307,798 | 171,174 | 2 | 2 | 15.7 | 17.1 |
| 2019 | 400,684 | 208,081 | 2 | 2 | 16.4 | 15.9 |
| 2024 | 315,682 | 218,893 | 3 | 2 | 14.7 | 11.9 |
Note: Registered foreigners are long-term residents who register with immigration authorities. All resident foreigners also include short-term visitors and F-4 residence reporters. Excludes Korean-Chinese, whom the Ministry of Justice counts separately.
Source: KIRD dataset, from Ministry of Justice immigration yearbooks, 2006-2024.
Distribution by Province and District
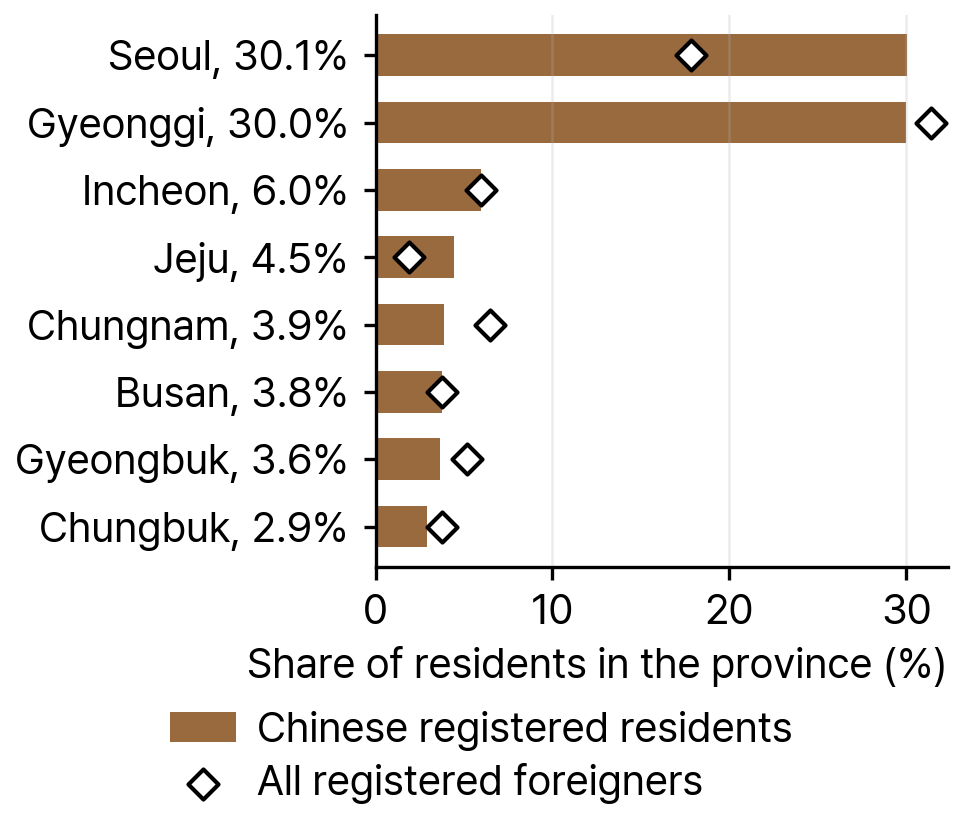
District data cover registered foreigners. Of the 218,893 registered Chinese nationals in 2024, 36.0 percent lived in Incheon and Gyeonggi and 30.1 percent in Seoul, so 66.0 percent were in the capital region, compared with 55.2 percent of all resident foreigners. Yeongnam had 13.0 percent, Chungcheong 9.2 percent, and Honam and Gangwon-Jeju 5.9 percent each. Only 3.9 percent lived in rural counties (gun), against 10.6 percent of all resident foreigners.
Source: KIRD dataset, from Ministry of Justice registered foreigner statistics by district, 2024.
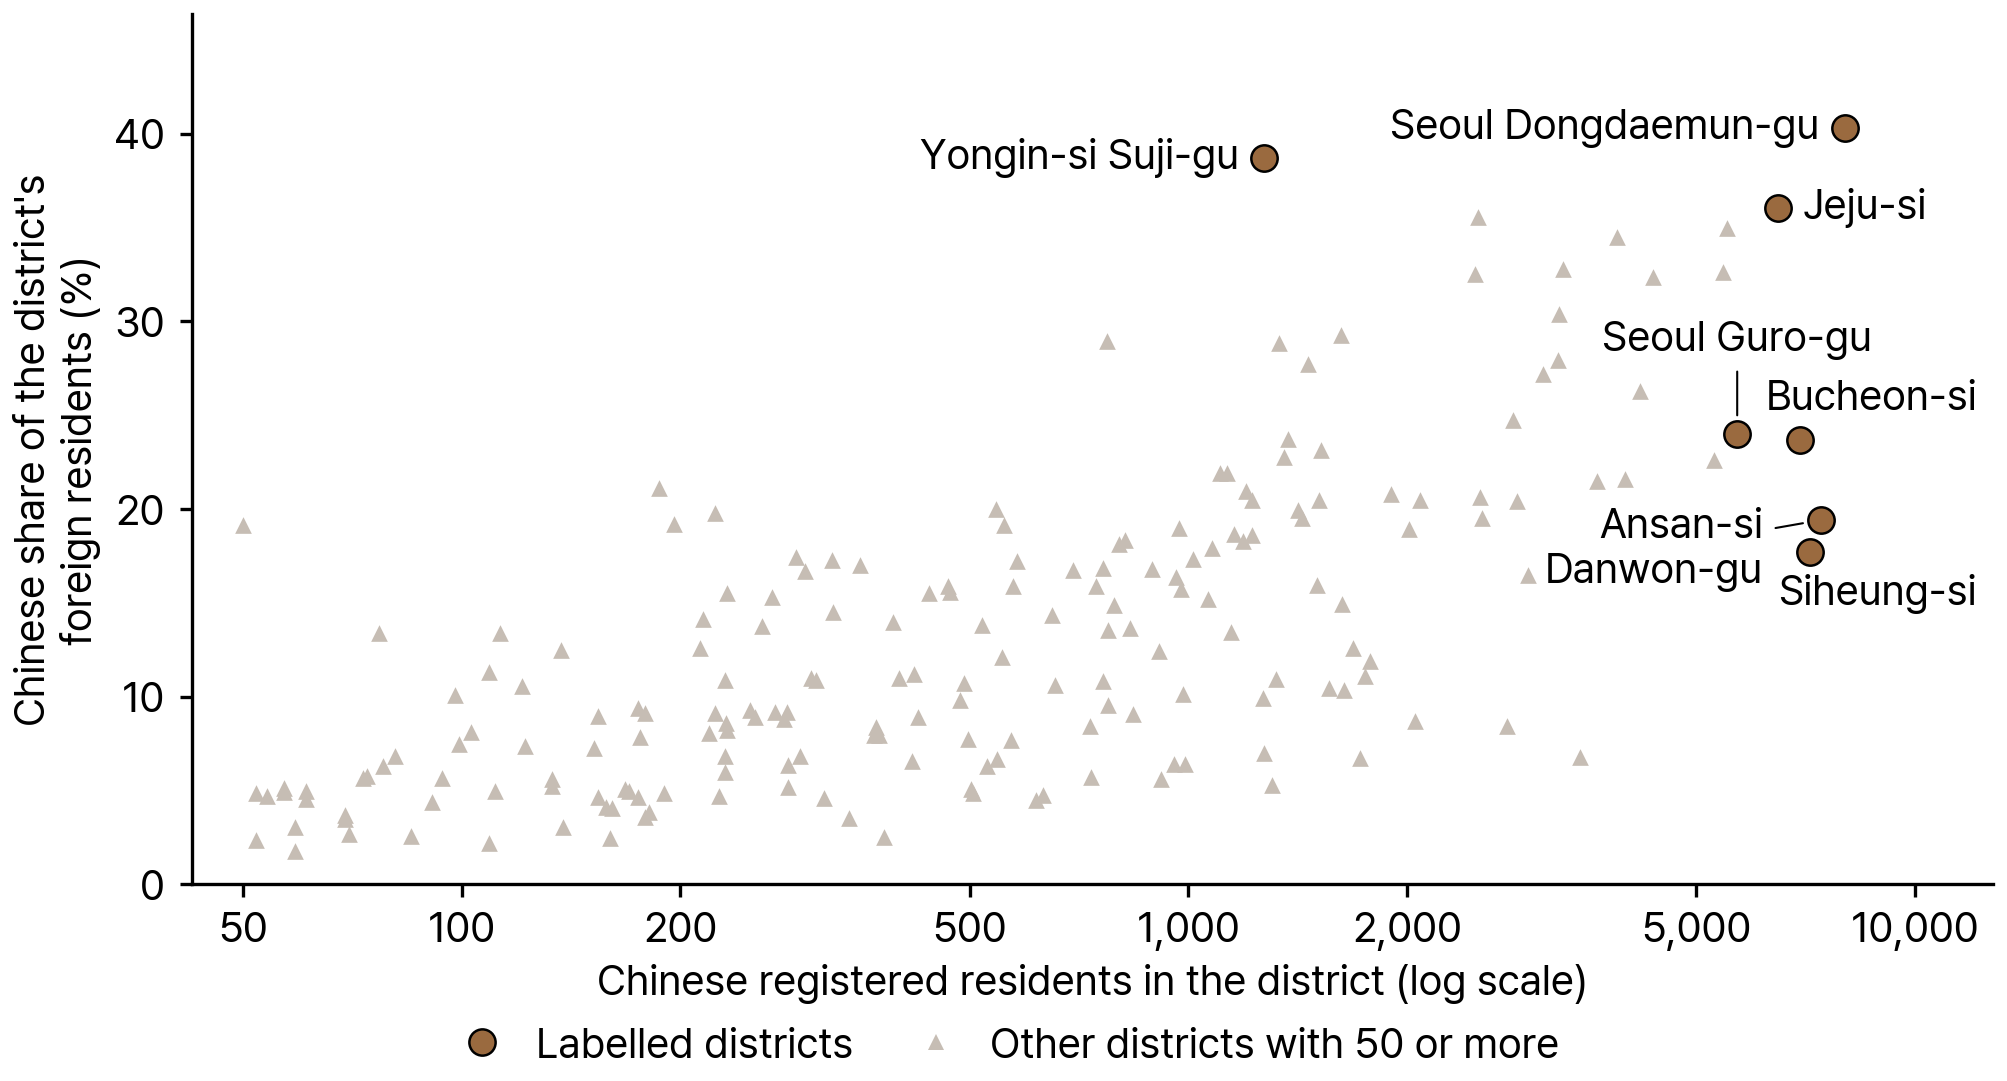
In 2024, 176 districts had at least 100 registered Chinese nationals. The ten largest districts together accounted for 28.5 percent of the group. Dongdaemun-gu in Seoul had the most (8,007), followed by Danwon-gu in Ansan (7,440), Siheung (7,179), and Bucheon (6,944). Jeju-si (6,479) was the largest district outside the capital region.
Source: KIRD dataset, from Ministry of Justice registered foreigner statistics by district, 2024.
Table 2Ten Districts with the Most Registered Chinese Nationals, 2024
| District | Province | Registered Chinese nationals | Share of district's registered foreigners (%) |
|---|---|---|---|
| Dongdaemun-gu | Seoul | 8,007 | 40.3 |
| Danwon-gu, Ansan-si | Gyeonggi-do | 7,440 | 19.4 |
| Siheung-si | Gyeonggi-do | 7,179 | 17.7 |
| Bucheon-si | Gyeonggi-do | 6,944 | 23.7 |
| Jeju-si | Jeju-do | 6,479 | 36.0 |
| Guro-gu | Seoul | 5,697 | 24.0 |
| Seodaemun-gu | Seoul | 5,517 | 35.0 |
| Gwangjin-gu | Seoul | 5,447 | 32.6 |
| Yeongdeungpo-gu | Seoul | 5,295 | 22.6 |
| Seongbuk-gu | Seoul | 4,362 | 32.4 |
Note: The ten districts held 28.5 percent of the 218,893 registered Chinese nationals.
Source: KIRD dataset, from Ministry of Justice registered foreigner statistics by district, 2024.
The index of dissimilarity between Chinese nationals and other registered foreigners rose from 0.294 in 2014 to 0.379 in 2024, so the group's distribution across districts moved further from that of other foreigners over the decade.
Ten districts met the enclave definition in 2024. Seven were in Seoul: Jongno-gu (3,890 people, location quotient 6.6), Jung-gu (3,243, 6.3), Dongdaemun-gu (8,007, 5.5), Seodaemun-gu (5,517, 4.3), Gwangjin-gu (5,447, 3.8), Seongbuk-gu (4,362, 2.4), and Seongdong-gu (2,479, 2.1). The other three were Seogwipo-si (3,285, 4.2) and Jeju-si (6,479, 3.1) on Jeju, and Cheongwon-gu in Cheongju (2,504, 3.1). In Dongdaemun-gu, Chinese nationals made up 40.3 percent of all registered foreigners.
Age and Sex
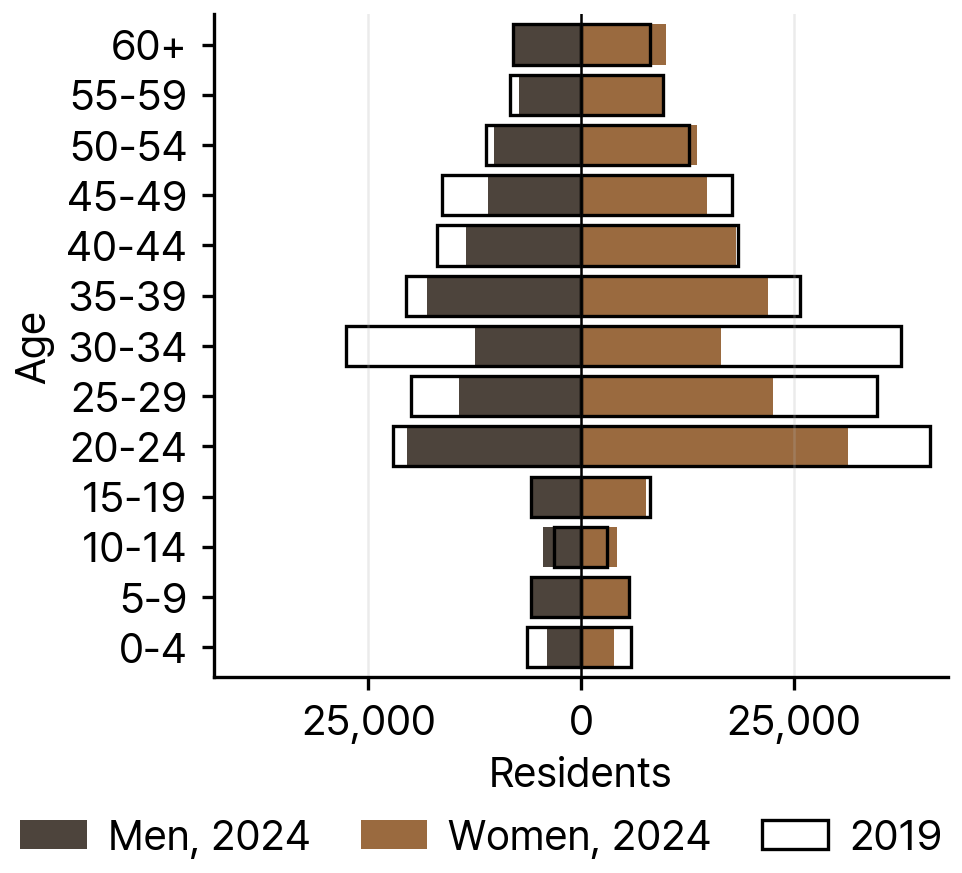
Women made up 57.0 percent of Chinese residents in both 2019 and 2024 (180,022 of 315,682 in 2024), compared with 45.1 percent of all resident foreigners in 2024. The largest five-year age group in 2024 was 20-24, and the median person fell in the 30-34 group.
Half of Chinese residents (50.0 percent) were aged 20 to 39 in 2024, about the same as all resident foreigners (49.7 percent). Children under 15 were a larger share (8.9 percent versus 5.7 percent), and people aged 60 and over a smaller share (5.8 percent versus 12.9 percent). The number of children under 5 fell from 12,173 in 2019 to 7,946 in 2024, while the number aged 50 and over changed little (58,065 and 58,990).
Source: KIRD dataset, from Ministry of Justice immigration yearbooks, 2006-2024.
Visa Status
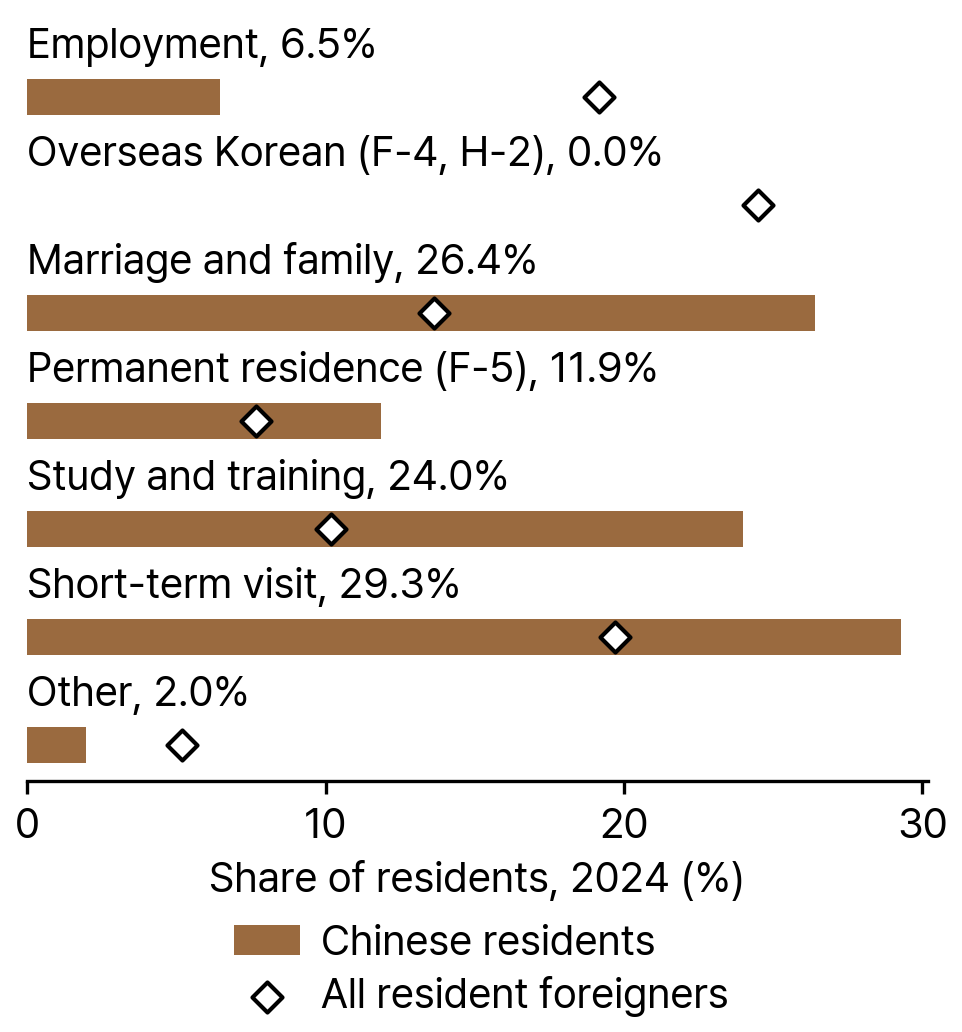
Chinese residents held a different mix of visas from other foreigners in 2024. Short-term visits accounted for 29.3 percent of the group (19.7 percent of all resident foreigners), study and training for 24.0 percent (10.2 percent), marriage and family statuses for 26.4 percent (13.6 percent), and permanent residence (F-5) for 11.9 percent (7.7 percent). Employment visas accounted for 6.5 percent, compared with 19.2 percent of all resident foreigners. The overseas Korean statuses (F-4, H-2), held by 24.5 percent of all resident foreigners, do not apply to this group.
Source: KIRD dataset, from Ministry of Justice immigration yearbooks, 2006-2024.
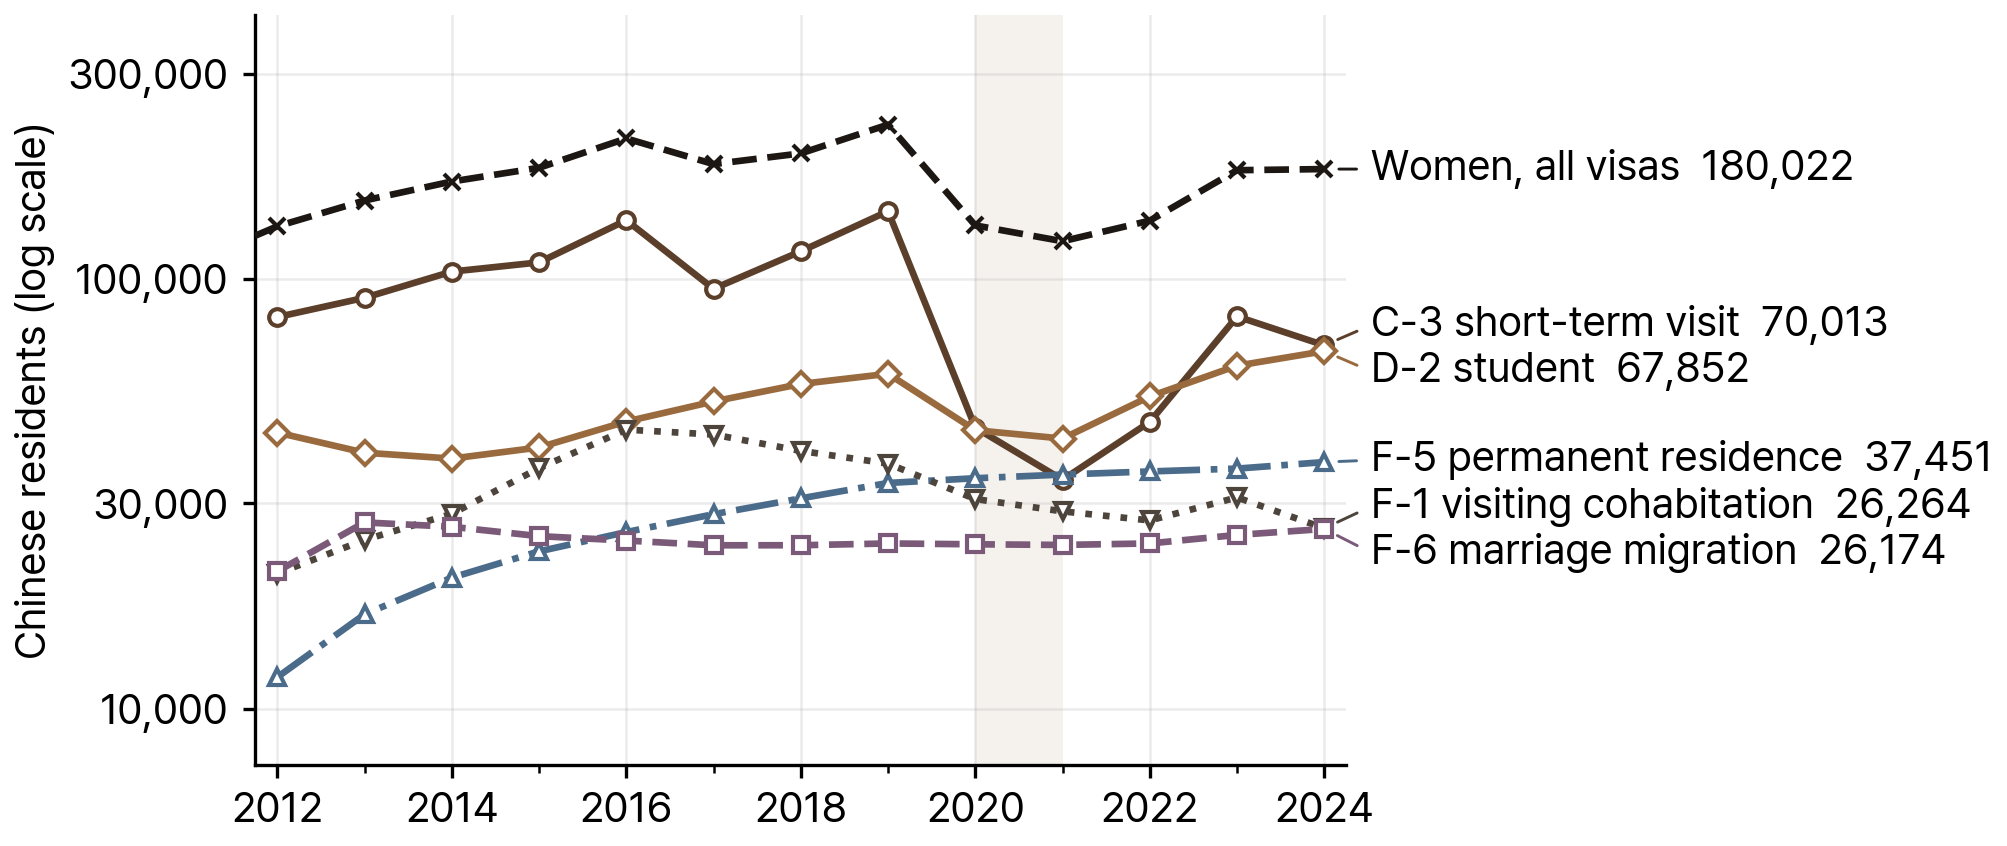
The C-3 short-term visit visa was the most common single status, and Chinese nationals were the largest nationality among its holders, with 43.0 percent of all C-3 holders in Korea in 2024. They also held 38.0 percent of all D-2 student visas and 38.0 percent of all F-2 residential visas. Between 2019 and 2024, D-2 students rose from 60,115 to 67,852, F-5 permanent residents from 33,485 to 37,451, and F-2 holders from 17,764 to 23,304, while C-3 holders fell by 73,604 and F-1 holders by 10,888.
Source: KIRD dataset, from Ministry of Justice immigration yearbooks, 2006-2024.
Table 3Most Common Visas Held by Chinese Residents in South Korea, 2019 and 2024
| Visa | Meaning | 2019 | 2024 | Share of Chinese residents, 2024 (%) | Chinese share of all holders of this visa, 2024 (%) |
|---|---|---|---|---|---|
| C-3 | Short-term visit | 143,617 | 70,013 | 22.2 | 43.0 |
| D-2 | Student | 60,115 | 67,852 | 21.5 | 38.0 |
| F-5 | Permanent residence | 33,485 | 37,451 | 11.9 | 18.5 |
| F-1 | Visiting and joining family | 37,152 | 26,264 | 8.3 | 26.5 |
| F-6 | Marriage migration | 24,215 | 26,174 | 8.3 | 17.6 |
| F-2 | Residential | 17,764 | 23,304 | 7.4 | 38.0 |
| B-2 | Tourist and transit | 43,305 | 22,473 | 7.1 | 14.7 |
Note: Shares of Chinese residents use the 2024 total of 315,682.
Source: KIRD dataset, from Ministry of Justice immigration yearbooks, 2006-2024.
Migration Channels and Policy
Low-skilled Chinese workers come to Korea through the E-9 Employment Permit System, under which they may work for one employer and may change employers only if the employer breaks the law or the business closes. Korean-Chinese workers on H-2 visas may change employers (Lee and Cho, 2019). That study analyzed 42,089 occupational injury cases among Chinese-national migrant workers from January 2007 to September 2018.
Study is a larger channel. In 2020, 67,030 Chinese nationals were studying in Korea, 43.6 percent of all international students and the largest single nationality (Zhang and Kim, 2021). In July 2025 China was the second-largest source, with 71,509 students, behind Vietnam, out of a record 272,573 international students (Nongmin Ilbo, 2025).
Marriage is a third channel. China was the largest source country of marriage immigrants in 2024, with 33.4 percent of all marriage immigrants, ahead of Vietnam (23.0 percent), Japan (8.9 percent), and the Philippines (7.1 percent) (e-Nara Index, 2024). This national indicator differs in coverage from the F-6 count in the Visa Status section, where Chinese nationals held 17.6 percent of F-6 visas in 2024.
Two recent policy changes applied specifically to Chinese nationals, both concerning short-term visits. Jeju's visa-free entry program, in place since 2002 and used overwhelmingly by Chinese nationals, was suspended at midnight on 4 February 2020 because of COVID-19, the first suspension in its history (Headline Jeju, 2020), and resumed on 1 June 2022 (Headline Jeju, 2022). From 29 September 2025, Korea allowed visa-free entry for Chinese group tourists (parties of three or more booked through designated Korea-China travel agencies) for visits of up to 15 days, as a pilot set to run through 30 June 2026 (KOCIS, 2025). In June 2026 the Ministry of Justice extended it through 31 December 2026, the same period as China's visa-free entry for Korean nationals (Travel Times, 2026).
Naturalization
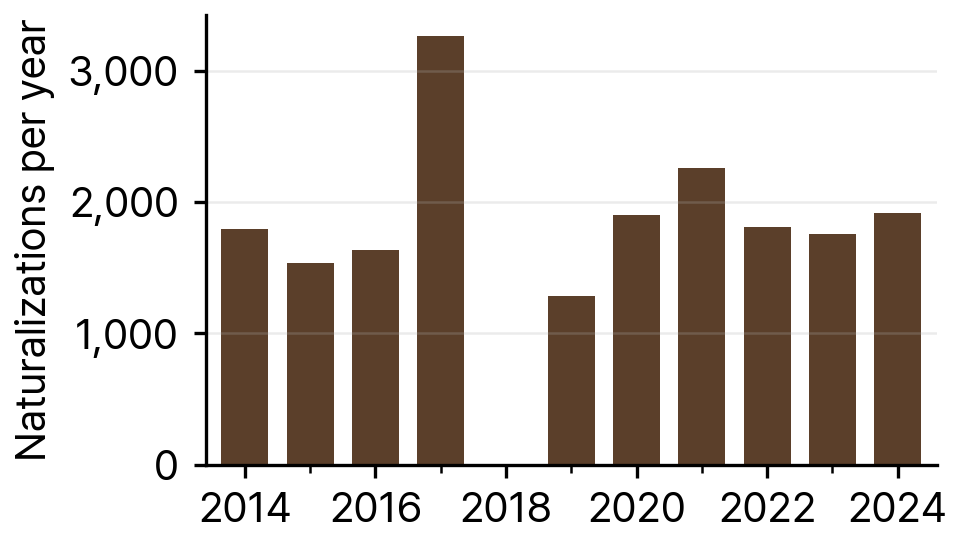
The KIRD dataset records 19,145 naturalizations of Chinese nationals from 2014 to 2024, drawn from the yearbook's by-country tables for 2014-2017 and 2019-2024; the 2018 yearbook reports China and Korean-Chinese together and is excluded. Annual numbers ranged from 1,282 (2019) to 2,257 (2021) in most years, with one higher year: 3,260 in 2017. In 2024, 1,915 Chinese nationals naturalized.
The yearbooks also record 832 restorations of Korean nationality by Chinese nationals from 2011 to 2024 (also excluding 2018), a procedure open to people who previously held Korean nationality. Only 39 restorations were recorded in 2024.
Source: KIRD dataset, from Ministry of Justice immigration yearbooks, 2006-2024.
Unauthorized Residents
China is among the ten nationalities that the Ministry of Justice yearbook (table 6-4) reports separately for unauthorized residents. The yearbook counted 70,536 unauthorized Chinese residents in 2019, 63,113 in 2021, 64,199 in 2023, and 61,906 in 2024. The 2024 figure was the third-largest by nationality and equaled 19.6 percent of all Chinese resident foreigners that year.
Chinese nationals made up 15.6 percent of the 397,522 unauthorized residents in Korea in 2024 (61,906 divided by 397,522). As a share of the Chinese resident population, the unauthorized count was 17.6 percent in 2019 (70,536 of 400,684), 28.0 percent in 2021 (63,113 of 225,528), and 20.4 percent in 2023 (64,199 of 314,945). The 2021 share was higher because the resident total fell by more than the unauthorized count.
Health and Well-being
In national injury data for 2007-2018, the adjusted fatality rate among injured Chinese-national E-9 workers was 1.80 times that of Korean-Chinese H-2 workers (95% CI 1.31-2.46). The authors attribute part of this difference to the E-9 rule against changing employers (Lee and Cho, 2019).
A cross-sectional study of 128 adult Chinese immigrants in Jung-gu, Seoul, most of them women in their 40s who had lived in Korea for 5 to 10 years, found depression associated with life satisfaction in China (p = .032), life satisfaction in Korea (p = .040), and perceived everyday stress (p = .001) (An, Moon, and Cha, 2019).
In interviews with 20 Chinese international students conducted after the COVID-19 outbreak, participants described online and neighborhood blame, wariness, and discrimination directed at them as Chinese, and coped by concealing their nationality or avoiding certain places and people (Zhang and Kim, 2021).
Migration from China to South Korea
To our knowledge, no published source reports what share of China's emigrants live in South Korea or where Korea ranks among their destinations. Korean statistics divide Chinese nationals into ethnic Koreans (Korean-Chinese) and all others; this Spotlight profiles the latter group, who numbered 315,682 in 2024.
The two groups changed at different rates in the national immigrant survey conducted by Statistics Korea and the Ministry of Justice. Between 2023 and 2024, Korean-Chinese residents rose by about 21,000 and other Chinese nationals fell by about 1,000 (Statistics Korea and Ministry of Justice 2024). In the 2025 survey, Korean-Chinese rose by about 13,000 and other Chinese nationals by about 4,000 over the previous year (Statistics Korea and Ministry of Justice 2025).
In 2026, China was one of the 17 countries whose workers may enter Korea under the general Employment Permit System (E-9), together with Vietnam, Cambodia, Nepal, Uzbekistan, and others (e-Nara Index 2026). E-9 admissions from China are small: 555 workers in 2024 and 393 in 2025 (Ministry of Employment and Labor 2026). In 2024, 3,159 Chinese nationals took the EPS-TOPIK and 2,062 passed (HRD Korea 2025). Outside the EPS, Chinese companies sent 428,000 workers abroad on contract in 2025, and 603,000 were abroad at the end of that year (MOFCOM 2026). Through this channel, 2,274 workers went to Korea in 2024, and 6,223 were in Korea at the end of that year (MOFCOM 2025). Study is a larger channel. In April 2025, Chinese nationals made up 30.2 percent of the 253,400 international students enrolled in Korean universities, the largest share of any nationality (Korea Herald 2025). This count differs in date and coverage from the July 2025 figure in the Migration Channels and Policy section.
Remittances are a small part of China's economy. Personal remittances received equaled 0.13 percent of China's GDP in 2020, according to World Bank data (Trading Economics 2020). The World Bank reports its regional remittance total for East Asia and the Pacific with China excluded; on that basis, remittances to the region grew 4.8 percent to $85 billion in 2023 (World Bank 2024). The World Bank's bilateral remittance estimates, last produced for 2021, put remittances sent from South Korea to China at about US$3.76 billion that year, about half of the US$7.46 billion estimated for all remittances sent from South Korea (World Bank 2021).
A study of Chinese nationals living in four clusters in Seoul and Suwon, a sample that includes both Korean-Chinese and other Chinese nationals, recorded the places in China they passed through before migration. Most had passed through one place in China before moving to Korea, most often the three northeastern provinces, including Yanji in Yanbian, or Shandong province. In the 2013 fieldwork in Daerim-dong, Shandong appeared at the first, second, and third stages of these routes; in the 2019 fieldwork in Suwon it appeared only at the first stage (Lee and Chung 2022). In the same clusters, Korean-Chinese far outnumbered other Chinese nationals. In Garibong-dong in 2015, 10,120 residents (93.1 percent) were registered as Korean-Chinese and 645 (5.9 percent) as other Chinese nationals.
On the policy side, the Korea-China Social Security Agreement, signed on 29 October 2012, took effect on 16 January 2013 (Ministry of Foreign Affairs, 2012). A person working in the other country who is enrolled in the home country's national pension and employment insurance is exempt from the corresponding programs of the country of work, for up to 13 years for posted workers and 5 years for locally hired workers, with no time limit for the self-employed (eToday 2012). On the Chinese side, companies that send workers abroad on contract fall under the State Council's Regulation on the Administration of Overseas Labor Service Cooperation (Decree No. 620), in force since 1 August 2012. It requires a qualification certificate from provincial commerce authorities, bars companies from taking a deposit or property guarantee from workers under any name, and requires each company to lodge a reserve fund of at least RMB 3 million for unpaid wages and repatriation costs (State Council 2012).
Research on this migration often compares Korean-Chinese with other Chinese nationals. Lee and Chung (2022) find that Korean-Chinese migrants have a more developed kin-based migration network than Han Chinese migrants, and they link this to the larger size and greater spatial differentiation of Korean-Chinese clusters such as Garibong-dong and Daerim-dong (Lee and Chung 2022). Using the National Multicultural Family Survey, Chang and Wallace (2015) find that Han Chinese marriage migrant wives reported good self-rated health more often (54 percent) than Vietnamese (50.5 percent) or Korean-Chinese (47 percent) wives. Han Chinese wives also more often ranked their natal families as wealthy, and 18 percent held a college degree, the highest share of the three groups. Junior high or high school education was associated with worse self-rated health among both Vietnamese and Han Chinese wives, and for Han Chinese wives with a college degree this negative association disappeared (Chang and Wallace 2015). We know of no study of brokers, migration debt, or return migration among Chinese nationals in Korea. Studies of work injuries and mental health appear in the Health and Well-being section.
Table 4Migration indicators, China and South Korea
| Indicator | Value | Source |
|---|---|---|
| Change in Chinese nationals other than Korean-Chinese, 2023-24 (survey) | About -1,000 (Korean-Chinese: about +21,000) | Statistics Korea and Ministry of Justice 2024 |
| Change in Chinese nationals other than Korean-Chinese, 2024-25 (survey) | About +4,000 (Korean-Chinese: about +13,000) | Statistics Korea and Ministry of Justice 2025 |
| Employment Permit System sending countries, 2026 | 17, including China | e-Nara Index 2026 |
| E-9 workers admitted from China, 2024 and 2025 | 555 and 393 | Ministry of Employment and Labor 2026 |
| EPS-TOPIK test takers from China, 2024 | 3,159 (2,062 passed) | HRD Korea 2025 |
| Workers sent abroad by Chinese companies on contract, 2025 | 428,000 (603,000 abroad at year end) | MOFCOM 2026 |
| Chinese share of international students at Korean universities, April 2025 | 30.2% of 253,400 | Korea Herald 2025 |
| Personal remittances received, share of China's GDP, 2020 | 0.13% | Trading Economics 2020 |
| Remittances sent from South Korea to China, 2021 (World Bank estimate) | About US$3.76 billion | World Bank 2021 |
| Korea-China Social Security Agreement in force | 16 January 2013 | eToday 2012 |
Note: Survey changes are rounded estimates from the Statistics Korea and Ministry of Justice immigrant survey.
Source: Sources listed in each row.
Community Organizations
Korea has an older Chinese community, the overseas Chinese (Hwagyo), with its own institutions. In Incheon, merchant guilds of Guangdong origin (Gwangbang, 1889), of Tianjin, Shandong, and Manchuria origin (Bukbang, 1891), and of Shanghai, Zhejiang, and Fujian origin (Nambang, 1913) merged in December 1913 to form the Incheon Chinese Merchants Hall, the forerunner of today's Incheon Overseas Chinese Association. The community's governing body originated in the Incheon Chunghwa Hall, established in 1905 (Incheon In, 2025). Hwagyo schools teach in Chinese; one is the Overseas Chinese High School in Busan, which opened on 1 September 1951 (International School Information, Government of South Korea).
Of the 1,720 migrant-serving organizations in the KIRD census, 56 name Chinese nationals in their name or target group. Most are Ministry of Justice-designated program sites and provincial multicultural education support centers under the Ministry of Education. Examples include the Gunpo Migrants and Multicultural Center (Gunpo-si), the Ansan Foreign Residents Support Headquarters (Danwon-gu, Ansan-si), the Multicultural Education Institute of Hankuk University of Foreign Studies (Dongdaemun-gu, Seoul), the Jeju Migrant Center (Jeju-si), and the Jeonnam-Gwangju Foreign Residents Support Center (Gwangsan-gu, Gwangju). Most general-purpose migrant organizations, which do not name a nationality, also serve Chinese residents.
Sources
KIRD (Korea Immigration Regional Dashboard) dataset, openICPSR project 249944. https://doi.org/10.3886/E249944V1
Lee, J.Y., and S.I. Cho. 2019. Prohibition on Changing Workplaces and Fatal Occupational Injuries among Chinese Migrant Workers in South Korea. International Journal of Environmental Research and Public Health. https://pmc.ncbi.nlm.nih.gov/articles/PMC6766071/
Zhang, Yichi, and Min Ah Kim. 2021. Chinese International Students' Experiences of Social Stigma during the COVID-19 Pandemic in Korea. Health and Social Welfare Review 41 (1): 22-41. https://www.kihasa.re.kr/hswr/assets/pdf/1224/journal-41-1-22.pdf
Nongmin Ilbo. 2025. International student numbers, July 2025. https://www.nongmin.com/article/20250903500144
e-Nara Index. 2024. Marriage immigrants by nationality, from the Ministry of Justice Immigration and Foreign Policy Statistics Yearbook. https://www.index.go.kr/unity/potal/main/EachDtlPageDetail.do?idx_cd=2819
Headline Jeju. 2020. Suspension of visa-free entry to Jeju. https://www.headlinejeju.co.kr/news/articleView.html?idxno=407921
Korean Culture and Information Service. 2025. Visa-free entry for Chinese group tourists. https://www.korean-culture.org/koreanet/view.do?seq=1052463
An, J.Y., H. Moon, and S. Cha. 2019. Depression among Chinese immigrants in Seoul. Public Health Nursing. https://pubmed.ncbi.nlm.nih.gov/31240741/
Incheon In. 2025. History of the Incheon Chinese merchant community. https://www.incheonin.com/news/articleView.html?idxno=113039
International School Information. n.d. Overseas Chinese High School Busan, KOREA. Government of South Korea. http://www.isi.go.kr/schoolInfo/SinfoView.do?schoolType=ST01&schoolId=23
Statistics Korea and Ministry of Justice. 2024. 2024년 이민자체류실태 및 고용조사 결과 [Results of the 2024 Survey on Immigrants' Living Conditions and Labour Force]. Korea Policy Briefing. https://www.korea.kr/briefing/policyBriefingView.do?newsId=156666055
Statistics Korea and Ministry of Justice. 2025. 2025년 이민자체류실태 및 고용조사 결과 [Results of the 2025 Survey on Immigrants' Living Conditions and Labour Force]. Korea Policy Briefing. https://www.korea.kr/briefing/policyBriefingView.do?newsId=156735722
e-Nara Index. 2026. 고용허가제 고용동향 [Employment Permit System employment trends]. https://www.index.go.kr/unity/potal/main/EachDtlPageDetail.do?idx_cd=1501
Korea Herald. 2025. Foreign Students in South Korea Top 250,000 for 1st Time. https://www.koreaherald.com/article/10585060
Trading Economics. 2020. China: Remittance Inflows to GDP (World Bank data). https://tradingeconomics.com/china/remittance-inflows-to-gdp-percent-wb-data.html
World Bank. 2024. Remittances Slowed in 2023, Expected to Grow Faster in 2024. Press release, 26 June 2024. https://www.worldbank.org/en/news/press-release/2024/06/26/remittances-slowed-in-2023-expected-to-grow-faster-in-2024
eToday. 2012. 한-중 사회보험협정, 내년 초부터 발효 [Korea-China social insurance agreement to take effect early next year]. https://www.etoday.co.kr/news/view/667275
Lee, J.-H., & Chung, S.-Y. (2022). 이주 경로 분석을 통해 살펴본 중국 국적 이주민 집중거주지의 성장 및 분화 [The growth and divergence of Chinese nationality immigrants' residential concentrations in Korea through migration paths analysis]. Journal of the Korean Geographical Society, 57(2), 141-157. https://doi.org/10.22776/kgs.2022.57.2.141
Chang, H.-C., & Wallace, S. P. (2015). Migration processes and self-rated health among marriage migrants in South Korea. Ethnicity & Health, 21(1), 20-38. https://doi.org/10.1080/13557858.2014.992299
World Bank. 2021. Bilateral Remittance Estimates (WB_KNOMAD_BRE), Data360. https://data360api.worldbank.org/data360/data?DATABASE_ID=WB_KNOMAD&INDICATOR=WB_KNOMAD_BRE&REF_AREA=KOR
Human Resources Development Service of Korea (HRD Korea). 2025. 국가별 한국어시험 시행 정보 [EPS-TOPIK test takers and passes by country, 2024]. Archived April 21, 2025. https://web.archive.org/web/20250421163507/https://epstopik.hrdkorea.or.kr/epstopik/pass/candidate/selectChart.do?lang=ko
Ministry of Employment and Labor. 2026. 국가별 일반고용허가제 외국인근로자(E-9) 도입현황 [E-9 workers admitted under the Employment Permit System, by country], 2004-2025. KOSIS. https://kosis.kr/statHtml/statHtml.do?orgId=118&tblId=DT_11827_N001&conn_path=I2
Ministry of Commerce of the People's Republic of China (MOFCOM). 2026. 2025年我国对外劳务合作业务简明统计 [Brief statistics on China's overseas labour-service cooperation, 2025]. January 29, 2026. https://www.mofcom.gov.cn/tjsj/gwjjhztj/art/2026/art_818586f5a3384bb6b7f19507b208b67e.html
Ministry of Commerce of the People's Republic of China (MOFCOM). 2025. 对外投资合作国别(地区)指南:韩国(2025年版) [Country guide for outward investment and cooperation: South Korea, 2025 edition], section 3.5.4. https://www.mofcom.gov.cn/dl/gbdqzn/upload/hanguo.pdf
State Council of the People's Republic of China. 2012. 对外劳务合作管理条例 [Regulation on the Administration of Overseas Labor Service Cooperation], Decree No. 620, June 4, 2012. https://www.gov.cn/gongbao/content/2012/content_2161721.htm
Headline Jeju. 2022. Jeju to allow visa-free entry from June, restarting the foreign tourism market (in Korean). 4 May 2022. https://www.headlinejeju.co.kr/news/articleView.html?idxno=484644
Travel Times (여행신문). 2026. Visa-free entry for Chinese group tourists continues to the end of the year (in Korean). 29 June 2026. https://www.traveltimes.co.kr/news/articleView.html?idxno=416057
Ministry of Foreign Affairs. 2012. Korea-China Social Security Agreement to take effect on 16 January next year (in Korean; press release). 20 December 2012. https://www.mofa.go.kr/www/brd/4080/view.do?seq=345094&page=1260&pitem=10
Suggested citation: Korea Immigration Regional Dashboard (KIRD). 2026. “Chinese Immigrants in South Korea.” Foreign Residents in South Korea series, September 2026. Data: Korea Immigration Regional Dashboard (KIRD) dataset, https://doi.org/10.3886/E249944V1. Interactive maps and tables: https://immigrantsinkorea.today.