 Korea Immigration Regional Dashboard
SpotlightSeptember 2026Province profilesDownload PDF
Foreign Residents in Sejong
Highlights
- Sejong had 6,182 registered foreigners at the end of 2024, the fewest among South Korea's 17 provinces and metropolitan cities and 0.4 percent of the national total of 1,488,353.
- Between 2014 and 2024, Sejong's Korean resident population grew 150.2 percent and its registered foreigners 126.4 percent, so registered foreigners per 100 Korean residents fell from 1.7 to 1.6, the second-lowest ratio of the 17 provinces in 2024 (the national ratio was 2.9).
- In 2024, 23.1 percent of Sejong's registered foreigners were on study and job-search statuses (D-2, D-4 and D-10), compared with 18.6 percent nationally, and 22.4 percent were on settlement statuses (F-2, F-5 and F-6), compared with 27.6 percent nationally.
Sejong Special Self-Governing City had 6,182 registered foreigners on 31 December 2024, the fewest of South Korea's 17 provinces and metropolitan cities (referred to here as provinces) and 0.4 percent of the country's 1,488,353 registered foreigners. The Ministry of the Interior and Safety counted 10,739 foreign residents in Sejong on 1 November 2024, a broader count that includes naturalized citizens and the children of foreign residents. Sejong was created on 1 July 2012, so the series for the city begin that year, when it had 2,360 registered foreigners.
Registered foreigners in Sejong more than doubled between 2014 and 2024, from 2,730 to 6,182 (an increase of 126.4 percent), while the city's Korean resident population rose from 156,125 to 390,685 (150.2 percent). Because Korean residents increased faster, registered foreigners per 100 Korean residents fell from 2.1 in 2012 to 1.7 in 2014 and 1.6 in 2024, when Sejong ranked 16th of the 17 provinces on this measure; the national ratio was 2.9. The registered-foreigner count rose to 5,700 in 2019, fell to 4,884 in 2021 and then rose each year to 6,182 in 2024. Its increase of 8.5 percent between 2019 and 2024 was the second-lowest among the 17 provinces, while Sejong's Korean population grew 14.7 percent over the same period.
Sejong's registered foreigners came from 94 nationalities in 2024, and by the Shannon diversity index the city had the third most diverse foreign population of the 17 provinces. China (18.7 percent) and Vietnam (18.0 percent) were the largest groups, and Korean-Chinese made up 9.2 percent, compared with 16.6 percent of registered foreigners nationwide. Sejong had the lowest median age of any province in 2022, 38.8 years (Statistics Korea, 2024), and in 2025 it was the only province where births exceeded deaths (Statistics Korea, 2026). This Spotlight describes the size of the foreign-resident population, its nationalities and residence statuses, districts, population trends, foreign workers, international students, provincial policy, languages, and service organizations.
Size of the Foreign-Resident Population
Sejong had 2,360 registered foreigners at the end of 2012, the year the city was created. The count rose to 2,730 in 2014 and 5,700 in 2019, fell to 5,076 in 2020 and 4,884 in 2021, during the COVID-19 pandemic, and then rose each year to 6,182 in 2024, about 2.6 times the 2012 count.
The Ministry of the Interior and Safety count of foreign residents grew from 2,515 in 2012 to 3,782 in 2014 and 9,814 in 2019, declined to 9,382 in 2020 and 9,335 in 2021, and rose to 10,739 in 2024, about 4.3 times the 2012 count.
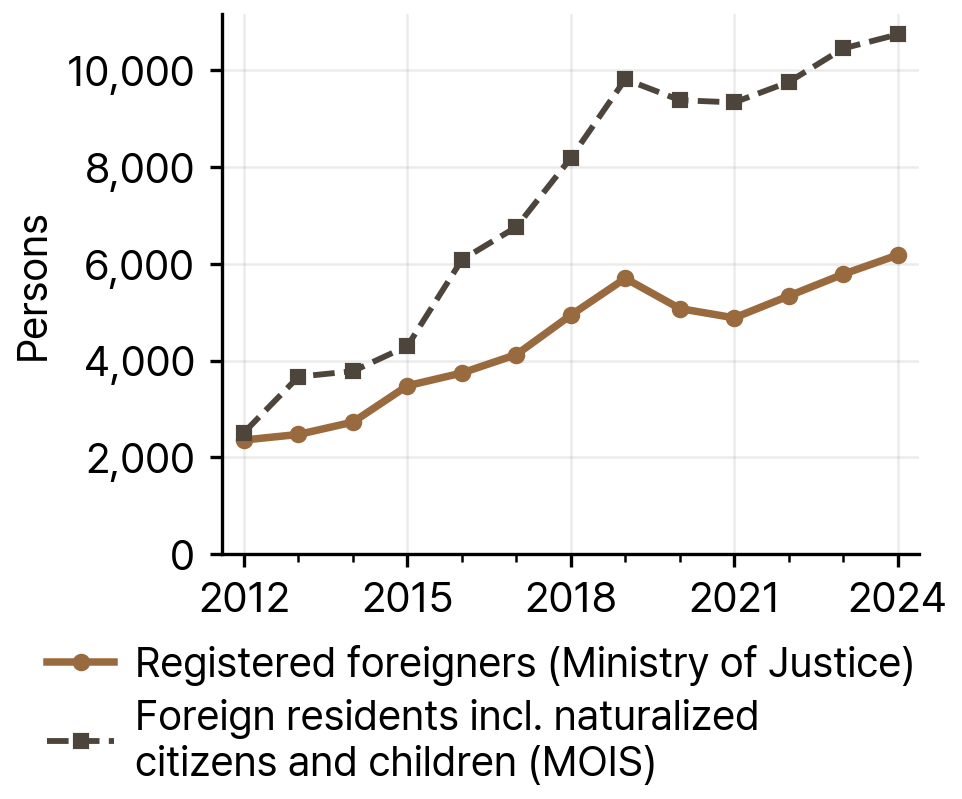
Source: KIRD dataset, from Ministry of Justice immigration yearbooks and Ministry of the Interior and Safety statistics, 2012-2024.
With 2014 set to 100, Sejong's Korean resident population rose every year, to an index of 250.2 in 2024. The index for registered foreigners rose to 208.8 in 2019, fell to 178.9 in 2021 and rose to 226.4 in 2024. The figure also plots the same two measures for South Korea as a whole.
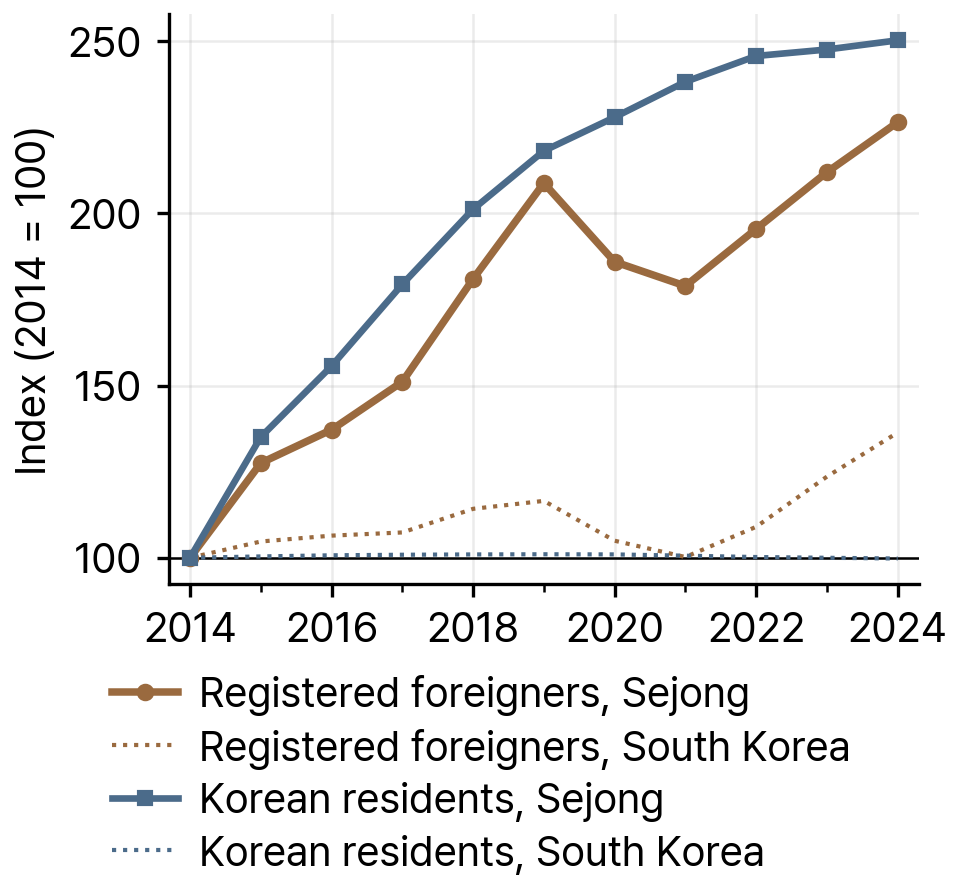
Source: KIRD dataset, from Ministry of Justice immigration yearbooks and Ministry of the Interior and Safety resident registration statistics, 2014-2024.
In 2024, Sejong ranked 17th of the 17 provinces by the number of registered foreigners and 16th by registered foreigners per Korean resident. It had 1.6 registered foreigners per 100 Korean residents, against 2.9 for South Korea as a whole, and accounted for 0.4 percent of the country's registered foreigners.
Table 1Registered Foreigners, MOIS Foreign Residents and Korean Residents in Sejong, Selected Years, 2012-24
| Year | Registered foreigners | MOIS foreign residents | Korean residents | Registered foreigners per 100 Korean residents |
|---|---|---|---|---|
| 2012 | 2,360 | 2,515 | 113,117 | 2.1 |
| 2014 | 2,730 | 3,782 | 156,125 | 1.7 |
| 2019 | 5,700 | 9,814 | 340,575 | 1.7 |
| 2024 | 6,182 | 10,739 | 390,685 | 1.6 |
Note: Sejong was created on 1 July 2012, so 2012 is the first year available. Registered foreigners are counted on 31 December and MOIS foreign residents on 1 November; the MOIS count adds naturalized citizens and the children of foreign residents.
Source: KIRD dataset, from Ministry of Justice immigration yearbooks and Ministry of the Interior and Safety statistics, 2012-2024.
Nationalities
China and Vietnam were the largest nationalities among Sejong's registered foreigners in 2024, with 1,155 (18.7 percent) and 1,111 (18.0 percent). Korean-Chinese followed with 568 (9.2 percent), then nationals of Myanmar (363), Nepal (346), Cambodia (324) and Thailand (314). The ten largest nationalities made up 78.0 percent of registered foreigners (4,825 of 6,182).
Vietnamese nationals had outnumbered Chinese nationals in 2019 (1,250 against 912). Between 2019 and 2024 the Vietnamese count fell by 139 and the Korean-Chinese count by 257 (from 825 to 568), while the Chinese count rose by 243. Among the ten largest groups, the fastest growth was among nationals of Nepal (from 188 to 346, up 84.0 percent) and Myanmar (from 208 to 363, up 74.5 percent).
In 2024, compared with registered foreigners in South Korea as a whole, Sejong had higher shares of nationals of China (18.7 against 14.7 percent), Myanmar (5.9 against 3.5 percent) and Thailand (5.1 against 2.9 percent), and a lower share of Korean-Chinese (9.2 against 16.6 percent).
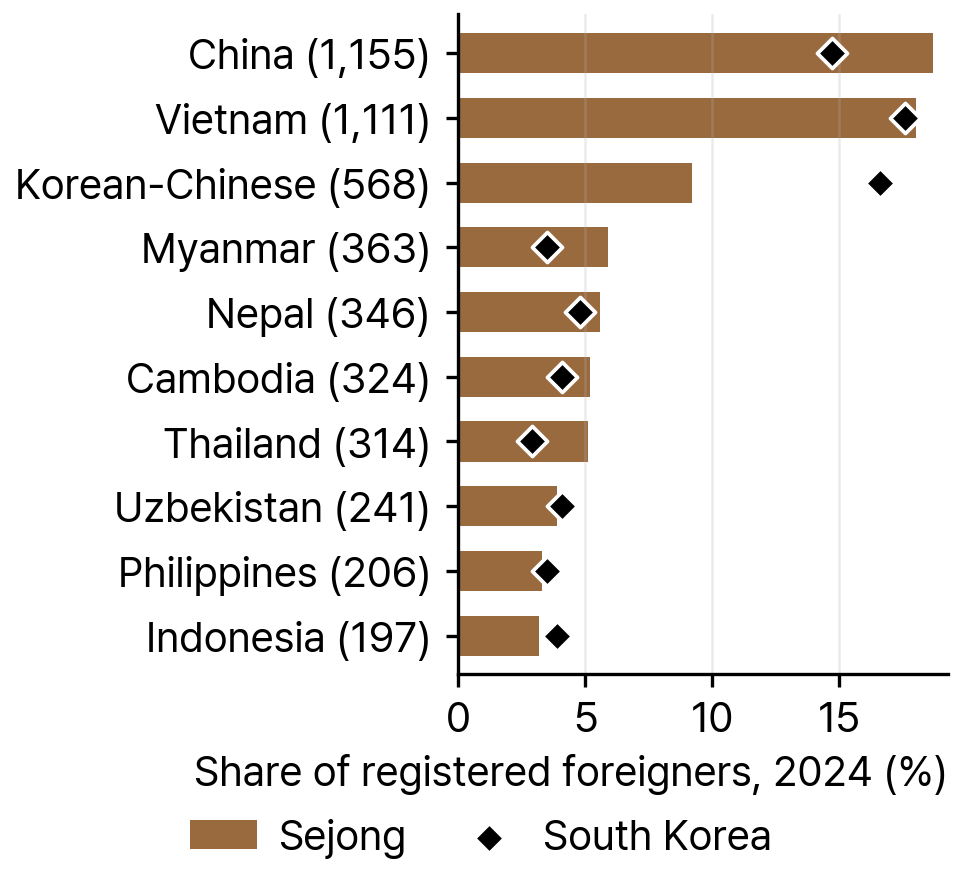
Source: KIRD dataset, from Ministry of Justice immigration yearbooks, 2024.
Table 2Ten Largest Nationalities among Registered Foreigners in Sejong, 2019 and 2024
| Nationality | 2019 | 2024 | Share of Sejong's registered foreigners, 2024 (%) | Sejong's share of this nationality in South Korea, 2024 (%) |
|---|---|---|---|---|
| China | 912 | 1,155 | 18.7 | 0.5 |
| Vietnam | 1,250 | 1,111 | 18.0 | 0.4 |
| Korean-Chinese | 825 | 568 | 9.2 | 0.2 |
| Myanmar | 208 | 363 | 5.9 | 0.7 |
| Nepal | 188 | 346 | 5.6 | 0.5 |
| Cambodia | 323 | 324 | 5.2 | 0.5 |
| Thailand | 326 | 314 | 5.1 | 0.7 |
| Uzbekistan | 243 | 241 | 3.9 | 0.4 |
| Philippines | 187 | 206 | 3.3 | 0.4 |
| Indonesia | 145 | 197 | 3.2 | 0.3 |
Note: Korean-Chinese are ethnic Koreans of Chinese nationality, counted separately from other Chinese nationals. Shares of Sejong's registered foreigners use the 2024 total of 6,182.
Source: KIRD dataset, from Ministry of Justice immigration yearbooks, 2019 and 2024.
Sejong had 0.4 percent of all registered foreigners in South Korea in 2024. Among nationalities with at least 1,000 registered foreigners in the country, its largest shares were of South Africans (71 of 4,641, or 1.5 percent), Canadians (41 of 4,452, 0.9 percent), British nationals (40 of 5,228, 0.8 percent), Ghanaians (9 of 1,224, 0.7 percent) and Kazakhs (150 of 20,482, 0.7 percent).
Sejong's registered foreigners came from 94 nationalities in 2024. The Shannon diversity index was 2.5 in 2014 and 2.6 in 2024, when it was the third highest among the 17 provinces.
Overseas Koreans on F-4 status report their residence instead of registering, so they are not among the registered foreigners counted above. In 2024, 1,445 F-4 holders had a reported residence in Sejong, 0.3 percent of the national total of 553,664 and equal to 23.4 percent of the city's registered-foreigner count. The largest groups were Korean-Chinese (827), U.S. nationals (271), Canadians (113), Uzbek nationals (88) and Korean-Russians (56).
Residence Statuses
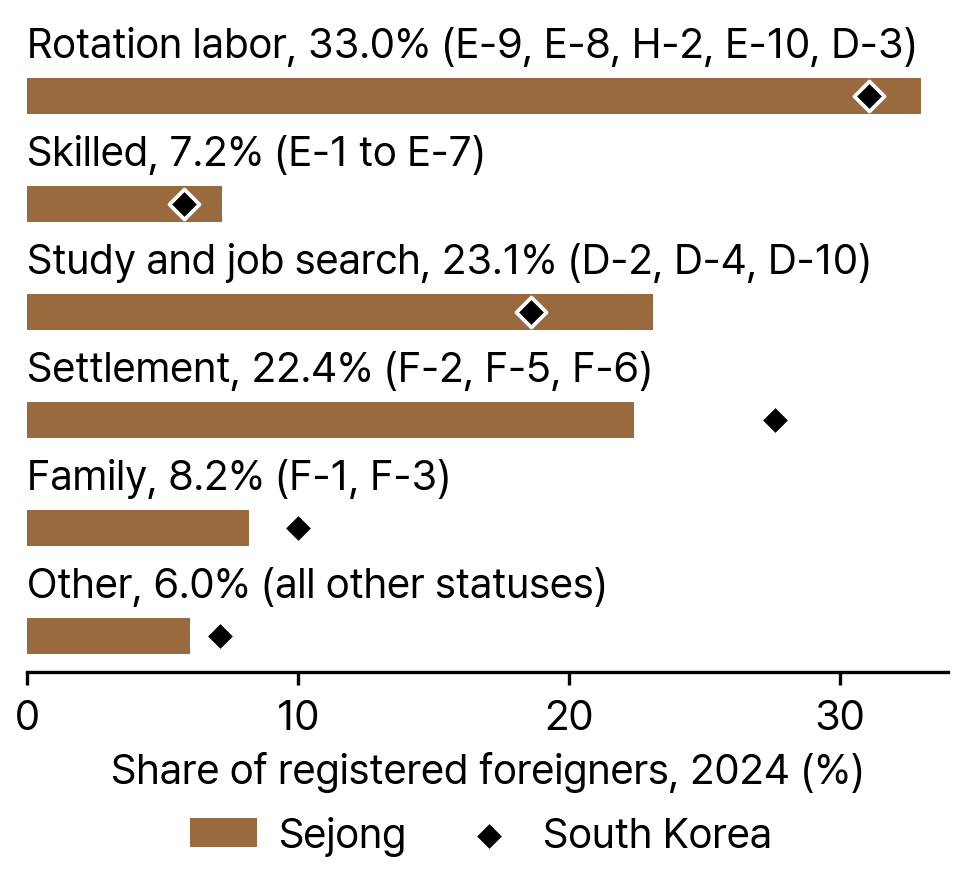
In 2024, rotation labor statuses (E-9, E-8, H-2, E-10 and D-3) covered 2,039 of Sejong's registered foreigners (33.0 percent, against 31.1 percent nationally). Study and job-search statuses (D-2, D-4 and D-10) covered 1,430 (23.1 percent, against 18.6 percent), settlement statuses (F-2, F-5 and F-6) 1,382 (22.4 percent, against 27.6 percent), family statuses (F-1 and F-3) 510 (8.2 percent, against 10.0 percent) and skilled statuses (E-1 to E-7) 448 (7.2 percent, against 5.8 percent). The remaining 373 (6.0 percent, against 7.1 percent) were on other statuses.
Source: KIRD dataset, from Ministry of Justice immigration yearbooks, 2024.
E-9 non-professional employment was the most common single status in 2024, with 1,739 holders (28.1 percent), followed by D-2 student (904, 14.6 percent), F-6 marriage migration (759, 12.3 percent), F-5 permanent residence (498, 8.1 percent) and D-4 general trainee (476, 7.7 percent). Sejong had 1.3 percent of all E-2 foreign language instructors in South Korea (175 people), the largest share among its ten most common statuses and above its 0.4 percent share of all registered foreigners. Its share of F-5 permanent residents was 0.2 percent.
Table 3Ten Most Common Residence Statuses among Registered Foreigners in Sejong, 2024
| Status | Meaning | Registered foreigners | Share of Sejong's registered foreigners (%) | Sejong's share of all holders in South Korea (%) |
|---|---|---|---|---|
| E-9 | Non-professional employment | 1,739 | 28.1 | 0.5 |
| D-2 | Student | 904 | 14.6 | 0.5 |
| F-6 | Marriage migration | 759 | 12.3 | 0.5 |
| F-5 | Permanent residence | 498 | 8.1 | 0.2 |
| D-4 | General trainee | 476 | 7.7 | 0.6 |
| F-1 | Visiting cohabitation | 377 | 6.1 | 0.4 |
| G-1 | Other (miscellaneous) | 304 | 4.9 | 0.5 |
| H-2 | Visiting employment | 259 | 4.2 | 0.3 |
| E-7 | Specially designated activities | 247 | 4.0 | 0.4 |
| E-2 | Foreign language instructor | 175 | 2.8 | 1.3 |
Note: Shares of Sejong's registered foreigners use the 2024 total of 6,182. Overseas Koreans on F-4 status report their residence instead of registering and are not included.
Source: KIRD dataset, from Ministry of Justice immigration yearbooks, 2024.
The Ministry of the Interior and Safety counted 10,739 foreign residents in Sejong on 1 November 2024. Of these, 7,992 were foreign nationals: 2,294 workers, 1,310 international students, 984 ethnic Koreans of foreign nationality, 956 marriage migrants and 2,448 others. The count also included 983 naturalized citizens and 1,764 children of foreign residents, together 25.6 percent of the total.
Districts and Population-Decline Areas
Sejong has a single district-level unit, Sejong-si, so the KIRD district-level data contain one entry for the city and no district figure is shown. Between 2019 and 2024, Sejong-si gained 50,110 Korean residents and 482 registered foreigners, and in 2024 it had 1.6 registered foreigners per 100 Korean residents.
Table 4Registered Foreigners and Korean Residents in Sejong-si, 2019-24
| District | Registered foreigners, 2024 | Registered foreigners per 100 Korean residents, 2024 | Change in Korean residents, 2019-24 | Change in registered foreigners, 2019-24 | Population-decline area |
|---|---|---|---|---|---|
| Sejong-si | 6,182 | 1.6 | +50,110 | +482 | No |
Note: Sejong has one district-level unit. Population-decline areas are those designated by the Ministry of the Interior and Safety on 19 October 2021.
Source: KIRD dataset, from Ministry of Justice immigration yearbooks, Ministry of the Interior and Safety resident registration statistics and the ministry's 2021 list of population-decline areas, 2019-2024.
Sejong-si was not among the 89 population-decline areas or the 18 areas of interest that the Ministry of the Interior and Safety designated on 19 October 2021.
No nationality in Sejong met the ethnic-enclave definition used in this Spotlight in 2024 (a location quotient of at least 2 and at least 30 percent of the district's registered foreigners). The largest group, China, made up 18.7 percent of registered foreigners.
Population Trends
Sejong's Korean resident population grew from 113,117 in 2012 to 156,125 in 2014, 340,575 in 2019 and 390,685 in 2024. It increased by 234,560 (150.2 percent) between 2014 and 2024 and by 50,110 (14.7 percent) between 2019 and 2024. The yearly increase was 54,759 in 2015, 26,449 in 2019, 2,934 in 2023 and 4,160 in 2024.
The city's statistics portal reported a total population of 397,359, including foreign residents, on 31 August 2026 (Sejong Statistics Portal, 2026).
Sejong's total fertility rate was 1.06 in 2025 (provisional), the second highest among the 17 provinces after South Jeolla (1.1). Sejong was the only province where births exceeded deaths in 2025, by 1,300, while the other 16 provinces recorded a natural decrease (Statistics Korea, 2026).
Sejong had the lowest median age of the 17 provinces in 2022, 38.8 years, and is projected to have the lowest in 2052 as well, at 52.1 years (Statistics Korea, 2024). In 2025 it had the lowest share of residents aged 65 and older, 11.6 percent (Bravo My Life, 2025, reporting Statistics Korea's 2025 statistics on older persons).
Statistics Korea's projections for 2022 to 2052 show Sejong's population growing 41.1 percent, and Gyeonggi (0.9 percent) is the only other province projected to grow. Sejong is also the only province where the working-age population (ages 15 to 64) is projected to grow, by 16.7 percent through 2052 (Statistics Korea, 2024).
Industry and Foreign Workers
Registered foreigners on E-9 non-professional employment status, the status for workers admitted under the Employment Permit System, numbered 1,145 in Sejong in 2014, 1,542 in 2019, 1,236 in 2021 and 1,739 in 2024. In 2024 they made up 28.1 percent of the city's registered foreigners and 0.5 percent of E-9 holders in South Korea.
Sejong's 2026 implementation plan under the 4th Basic Plan for Immigration Policy reports that the city's registered foreigners have gradually increased since the COVID-19 pandemic and that foreign workers are increasing in agriculture, a sector with severe labor shortages. The plan describes Sejong's farming as moving toward multi-crop, small-volume production, with consumer markets nearby and more small farms, and reports that rising farmland prices are increasing the number of small-scale farmers (Ministry of Justice, 2026).
E-8 seasonal workers counted on 31 December numbered 6 in 2022, 10 in 2023 and 40 in 2024. The year-end count misses most seasonal workers, whose contracts end before winter. Sejong's seasonal worker program for the first half of 2025 allowed employment in facility horticulture, specialty crops, mushrooms and orchard fruit, and excluded livestock farming (Sejong City, 2025). Eligibility for the program is described under Provincial Policy.
Sejong's page on the Jeonui industrial park, which covers 1,347,229 square meters, lists 44 companies employing 2,877 workers, split between Jeonui 1 (8 companies, 1,339 workers) and Jeonui 2 (36 companies, 1,538 workers) (Sejong City, 2026a).
International Students and Universities
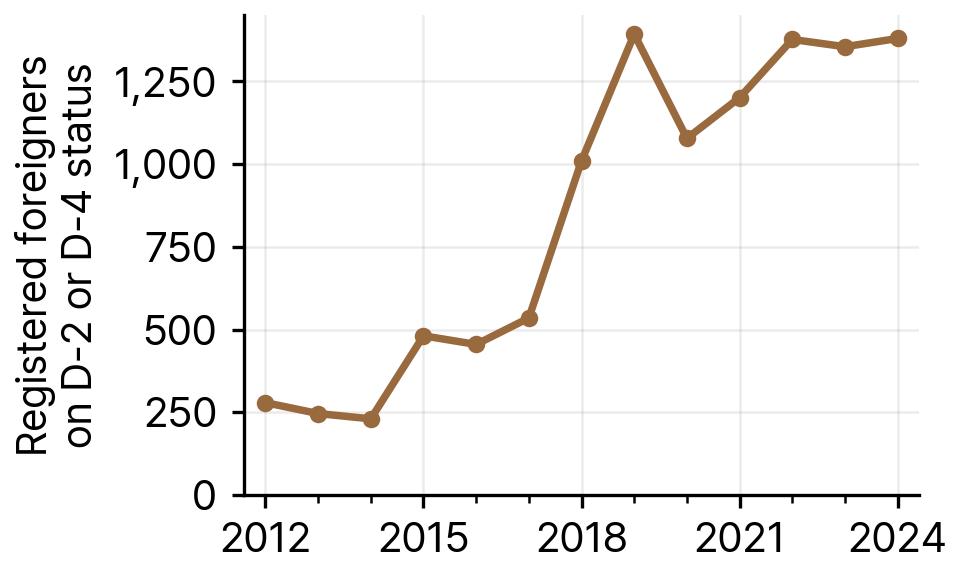
Registered foreigners on student (D-2) or general trainee (D-4) status numbered 279 in Sejong in 2012 and 230 in 2014. The count rose to 535 in 2017, 1,010 in 2018 and 1,393 in 2019, fell to 1,078 in 2020, and was 1,380 in 2024, when 904 were on D-2 status and 476 on D-4 status. In 2024 the two statuses covered 22.3 percent of Sejong's registered foreigners and 0.5 percent of D-2 and D-4 holders in South Korea.
Source: KIRD dataset, from Ministry of Justice immigration yearbooks, 2012-2024.
Korea University and Hongik University have Sejong campuses in Jochiwon-eup. The city's other higher-education institutions are Korea University of Media Arts, a junior college in Janggun-myeon, the KDI School of Public Policy and Management, a graduate school in Bangok-dong, and Daejeon Catholic University in Jeonui-myeon. Sejong University, despite its name, is in Seoul (Sejong University, n.d.).
Chungcheong Today, citing Ministry of Education and Korean Educational Development Institute data, reported that international students at universities in Sejong rose from 1,026 in 2022 to 1,356 in April 2026, and that 56 international students in Sejong withdrew from their studies in the previous year, out of more than 1,200 a year in the Chungcheong region (Chungcheong Today, 2026). The university count and the KIRD count of D-2 and D-4 holders differ in source, reference date and coverage.
City support for international students, including the Sejong Global Leader program and stipends for students at the KDI School, is described under Provincial Policy.
Provincial Policy
Sejong's Ordinance on Support for Foreign Residents and Multicultural Families (Sejong Ordinance No. 375) took effect on 30 July 2013 (National Law Information Center, 2013).
The Population, Women and Family Affairs Division is part of Sejong's Health and Welfare Bureau (Sejong City, 2026b). The city's 2026 implementation plan under the 4th Basic Plan for Immigration Policy lists this division as responsible for multicultural-family programs such as Korean-language education and job support for marriage migrants. Other units handle other programs for foreign residents, including the Agricultural Policy Division for seasonal workers and the External Cooperation Officer for international students (Ministry of Justice, 2026).
According to the plan, the city's Family Center provided Korean-language education in 2025 to marriage migrants and to children who came to Korea later in childhood, through five courses (among them beginner Korean and Korean through television dramas) with 2,700 participants. In 2025 the city also paid living stipends to international students at the KDI School of Public Policy and Management and organized internationalization programs for them, to help them adapt to study in Korea and build international networks (Ministry of Justice, 2026).
The plan lists budgets of 52 million won a year for 2024, 2025 and 2026 for Sejong Global Leader, an international-student recruitment and support program managed by the External Cooperation Officer. The budget for the city's citizen safety insurance for foreign residents rises from 198 million won in 2025 to 235 million won in 2026, an increase of 18.7 percent (Ministry of Justice, 2026).
Sejong's seasonal worker program for the first half of 2025 was limited to family members in the home country, or relatives up to cousins, of marriage migrants living in the city, aged 19 to 55 (Sejong City, 2025).
Languages
The KIRD dataset estimates the first languages of registered foreigners by applying Ethnologue (24th edition) first-language shares to the count of each nationality, with Korean excluded. By this estimate, Chinese was the most common first language among Sejong's registered foreigners in 2024, with 1,144 speakers, followed by Vietnamese (951) and Khmer (326). Chinese was the only language with 1,000 or more estimated speakers.
Table 5Estimated First-Language Speakers among Registered Foreigners in Sejong, 2024
| Language | Estimated speakers |
|---|---|
| Chinese | 1,144 |
| Vietnamese | 951 |
| Khmer | 326 |
| Thai | 276 |
| Burmese | 233 |
| English | 210 |
| Nepali | 182 |
| Tagalog/Filipino | 181 |
| Uzbek | 180 |
| Russian | 144 |
Note: Estimates apply each nationality's first-language shares from Ethnologue to its registered-foreigner count. Korean is excluded.
Source: KIRD dataset, from Ministry of Justice immigration yearbooks and Ethnologue first-language shares, 2024.
Service Organizations and Community Places
The KIRD census of 1,720 migrant-serving organizations in South Korea lists 5 in Sejong, equal to 8.1 per 10,000 registered foreigners in 2024, against 11.6 per 10,000 nationally. They are a family center, a migrant worker support center, a Social Integration Program provider, a youth and multicultural education center and a medical support institution, and all five provide direct services.
Two of the organizations serve children, two serve families and two serve workers. One serves all migrants, one serves refugees and one serves undocumented migrants. Some organizations serve more than one population.
The migrant worker support center is the Sejong City Migrant Worker Welfare Center in Jochiwon-eup, a privately operated organization that supports foreign migrant workers and their children, with Korean-language education and programs for adapting to Korean society. In May 2026, Lotte Construction chose it as the 100th site of its Love House facility-improvement project (Asia Economy, 2026).
The Sejong Healthy Family and Multicultural Family Support Center, in the Saerom Integrated Welfare Center, describes its work as customized programs on family relationships, family care and family life for multicultural families and all other families (Sejong Welfare Platform, 2026).
To our knowledge, no published source describes gathering places, such as places of worship or shops, used by particular national groups in Sejong.
Sources
KIRD dataset (Korea Immigration Regional Dashboard), compiled from Ministry of Justice immigration yearbooks and Ministry of the Interior and Safety statistics, 2006-2024. openICPSR. https://doi.org/10.3886/E249944V1
Statistics Korea. 2024. Population Projections by Province: 2022-2052 (in Korean). Korea.kr policy briefing, 28 May 2024. https://www.korea.kr/briefing/policyBriefingView.do?newsId=156632807
Statistics Korea. 2026. 2025 Birth and Death Statistics (Provisional) (in Korean). Korea.kr policy briefing, 25 February 2026. https://www.korea.kr/briefing/policyBriefingView.do?newsId=156745912
Sejong Special Self-Governing City. 2026. Population Status. Sejong Statistics Portal (in Korean). https://www.sejong.go.kr/stat/bbs/list.do?key=1912123631625
Bravo My Life. 2025. [2025 Statistics on the Elderly] Which Age Group Will Make Up the Largest Share in 12 Years? (in Korean). 30 September 2025. https://bravo.etoday.co.kr/view/atc_view/17445
Ministry of Justice, Korea Immigration Service. 2026. 2026 Implementation Plan for the 4th Basic Plan for Immigration Policy: Sejong Special Self-Governing City (in Korean). https://www.immigration.go.kr/bbs/immigration/226/493580/download.do
Sejong Special Self-Governing City, Agricultural Policy Division. 2025. Foreign Seasonal Worker Program Guide, First Half of 2025 (in Korean). https://www.sejong.go.kr/bbs/R0071/view.do?nttId=B000000117802Hm9aW4g
Sejong Special Self-Governing City. 2026a. Industrial Parks and Internal Road Network: Jeonui Industrial Park (in Korean). https://www.sejong.go.kr/kor/sub04_060303.do
Chungcheong Today. 2026. 'Era of 300,000 International Students' Opens, but 1,200 a Year Pack Up and Leave in Chungcheong (in Korean). https://www.cctoday.co.kr/news/articleView.html?idxno=2237309
National Law Information Center. 2013. Sejong Special Self-Governing City Ordinance on Support for Foreign Residents and Multicultural Families, Ordinance No. 375 (in Korean). https://law.go.kr/LSW/ordinInfoP.do?gubun=ELIS&ordinSeq=846239
Sejong Special Self-Governing City. 2026b. Organization Chart: Health and Welfare Bureau (in Korean). https://www.sejong.go.kr/kor/sub01_010101.do
Asia Economy. 2026. Lotte Construction's 'Love House' No. 100 Improves Facilities at Sejong Migrant Worker Center (in Korean). https://view.asiae.co.kr/article/2026052810175375130
Sejong Special Self-Governing City. 2026. Sejong Welfare Resource Platform, Facility Information: Sejong Healthy Family and Multicultural Family Support Center (in Korean). https://pf.sjwf.or.kr/wfFacInfoDetail.es?mid=a10902000000&fi_seq=57
Sejong University, One Stop Service Center. n.d. Directions (찾아오시는 길). https://sos.sejong.ac.kr/kor/comm/menu/94394768f163aa96a851e572e595cc71/content/index.do
Suggested citation: Korea Immigration Regional Dashboard (KIRD). 2026. “Foreign Residents in Sejong.” Foreign Residents in South Korea series, September 2026. Data: Korea Immigration Regional Dashboard (KIRD) dataset, https://doi.org/10.3886/E249944V1. Interactive maps and tables: https://immigrantsinkorea.today.