 Korea Immigration Regional Dashboard
SpotlightSeptember 2026Province profilesDownload PDF
Foreign Residents in Seoul
Highlights
- Seoul had 265,544 registered foreigners at the end of 2024, the second-largest number among the 17 provinces (17.8 percent of the national total), and 450,888 foreign residents in the 2024 count of the Ministry of the Interior and Safety, which also includes naturalized citizens and children of foreign residents.
- Between 2019 and 2024, the number of registered foreigners in Seoul fell 5.8 percent, the lowest growth rate among the 17 provinces; over the same years, registered Korean-Chinese declined from 115,637 to 68,560, and registered foreigners on student or general trainee status (D-2 or D-4) rose from 62,081 to 83,673.
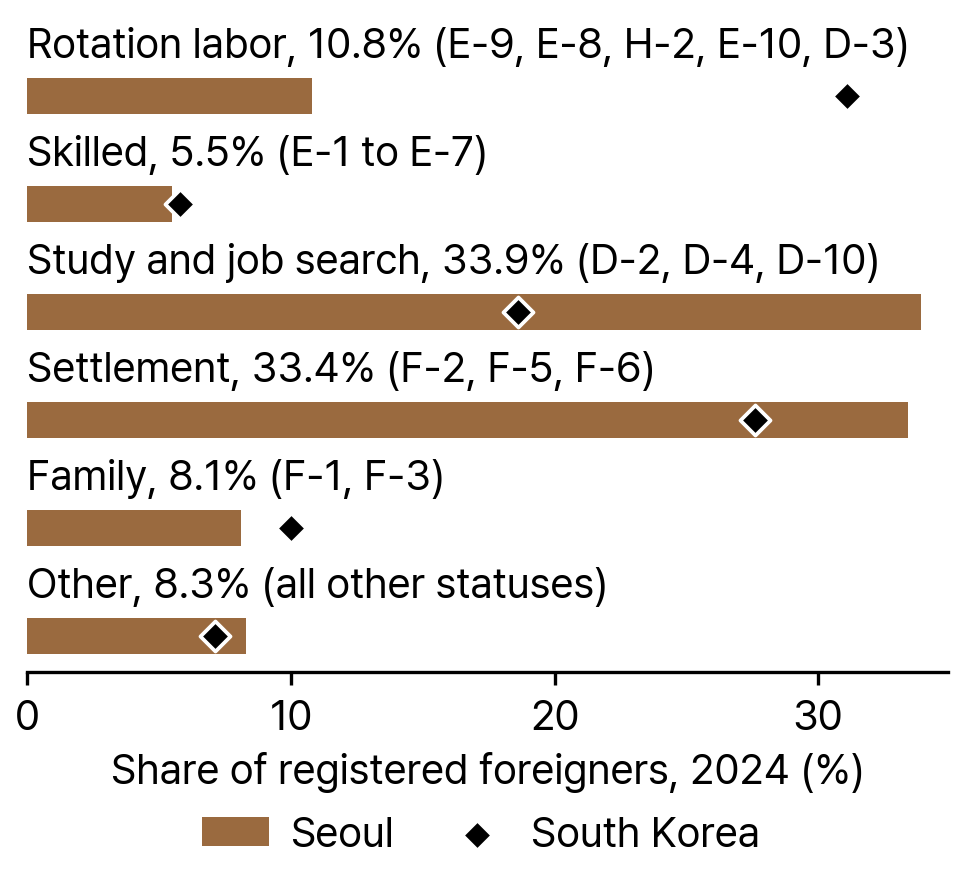
- In 2024, study and job-search statuses (33.9 percent) and settlement statuses (33.4 percent) together covered 67.3 percent of Seoul's registered foreigners, against 46.2 percent nationally, while rotation labor statuses covered 10.8 percent, against 31.1 percent nationally.
On 31 December 2024, Seoul was home to 265,544 registered foreigners, 17.8 percent of the 1,488,353 in South Korea. By that count it ranked second among the 17 provinces and metropolitan cities, after Gyeonggi Province. Relative to its Korean population it ranked ninth, with 2.8 registered foreigners per 100 Korean residents against 2.9 nationally. The Ministry of the Interior and Safety (MOIS), whose count also includes naturalized citizens and the children of foreign residents, recorded 450,888 foreign residents in Seoul in 2024, 1.7 times the registered count.
The number of registered foreigners in Seoul rose from 175,047 in 2006 to a high of 283,984 in 2018, fell to 226,569 in 2021 and recovered to 265,544 in 2024, close to the 2014 count of 266,360. Seoul's Korean population was 8.3 percent smaller in 2024 (9,331,828) than in 2006 (10,181,166), so the number of registered foreigners per 100 Korean residents rose from 1.7 to 2.8. Between 2019 and 2024, registered foreigners fell 5.8 percent (16,332 people), the lowest growth rate among the 17 provinces, and Korean residents fell 4.1 percent (397,279 people).
Seoul's foreign population differs from the national one in its residence statuses and nationalities. Two-thirds of its registered foreigners had study, job-search or settlement statuses in 2024, and between 2019 and 2024 the number on student or general trainee status rose by 21,592 while the number on all other statuses fell by 37,924. Korean-Chinese and Chinese nationals made up 50.6 percent of registered foreigners in 2024. Seoul was home to 44.2 percent of the Taiwanese and 37.1 percent of the Japanese nationals registered in South Korea, and to between 63.2 and 81.9 percent of the German, Italian, Spanish, French and Saudi nationals. Another 147,773 overseas Koreans of foreign nationality reported a residence in Seoul on F-4 status in 2024 and are not counted as registered foreigners.
Size of the Foreign-Resident Population
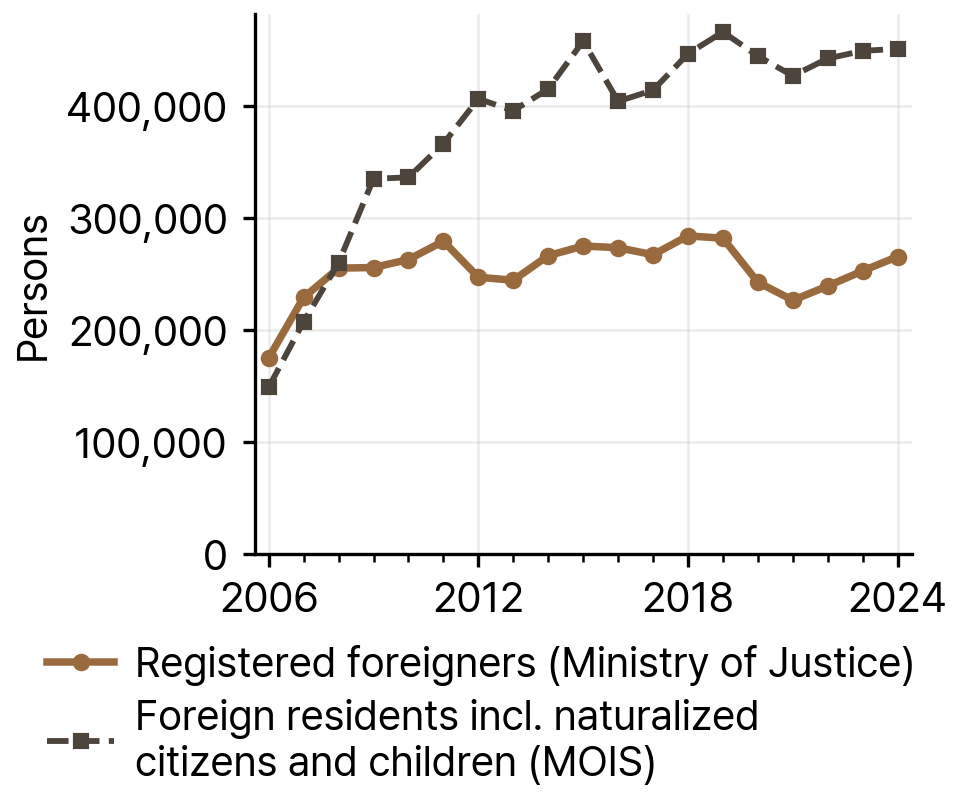
Seoul had 175,047 registered foreigners in 2006. The number rose each year to 279,220 in 2011, ranged between 244,410 (2013) and 283,984 (2018) from 2012 to 2019, and fell to 242,623 in 2020 and 226,569 in 2021. It rose again in each of the next three years, to 265,544 in 2024 (see Figure 1). The 2024 count was 51.7 percent above the 2006 count (90,497 more people) and 0.3 percent below the 2014 count (816 fewer).
The MOIS count of foreign residents was 148,966 in 2006 and peaked at 465,885 in 2019. It fell to 426,743 in 2021 and was 450,888 in 2024, about three times the 2006 figure. It has exceeded the registered count in every year since 2008. In 2024 it included 367,291 foreign nationals, 47,124 naturalized citizens and 36,473 children of foreign residents. The foreign nationals in the MOIS count outnumbered registered foreigners by 101,747 in 2024; the two ministries use different population definitions and reference dates.
Source: KIRD dataset, from Ministry of Justice immigration yearbooks and Ministry of the Interior and Safety foreign-resident statistics, 2006-2024.
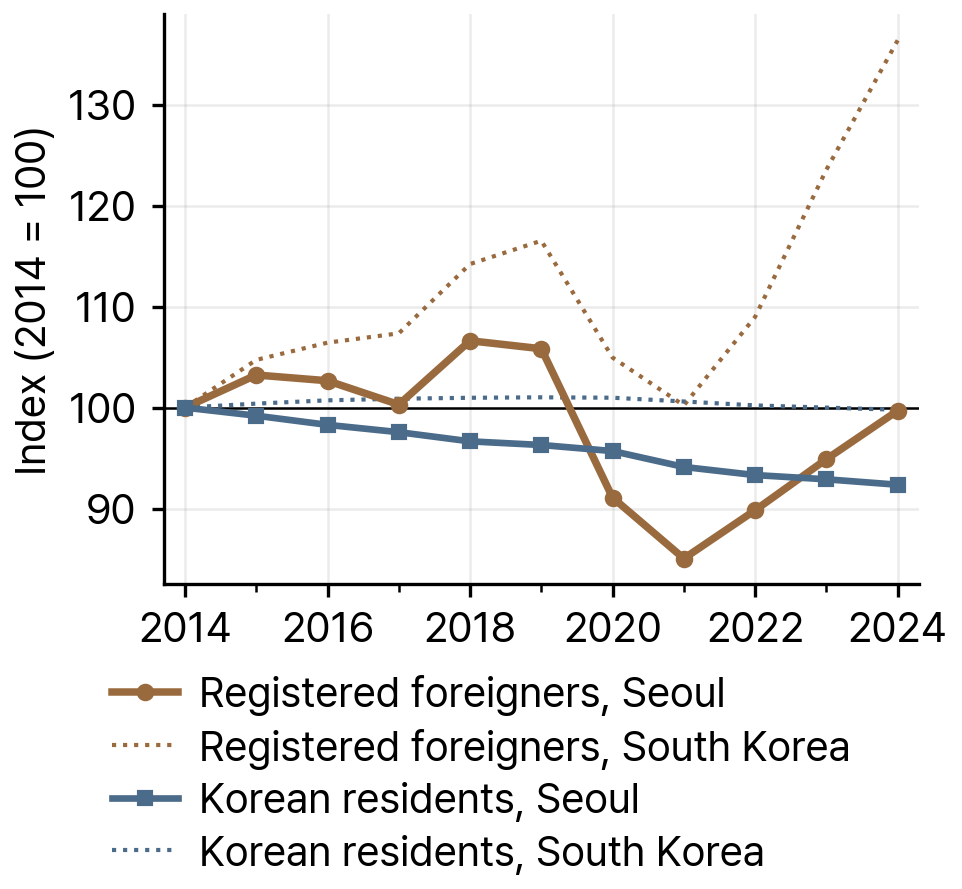
Seoul's Korean population declined in every year from 2011 to 2024. With 2014 set to 100, registered foreigners in Seoul stood at 99.7 in 2024 and Korean residents at 92.4 (see Figure 2). The number of registered foreigners per 100 Korean residents rose from 1.7 in 2006 to 2.6 in 2014 and 2.9 in 2019, and was 2.8 in 2024 (see Table 1). In 2024 Seoul ranked second among the 17 provinces by the number of registered foreigners and ninth by registered foreigners per Korean resident. Its registered foreign population fell 5.8 percent between 2019 and 2024, the lowest growth rate of the 17 provinces.
Source: KIRD dataset, from Ministry of Justice immigration yearbooks and Ministry of the Interior and Safety resident registration statistics, 2014-2024.
Table 1Registered Foreigners, MOIS Foreign Residents and Korean Residents in Seoul, Selected Years, 2006-24
| Year | Registered foreigners | MOIS foreign residents | Korean residents | Registered foreigners per 100 Korean residents |
|---|---|---|---|---|
| 2006 | 175,047 | 148,966 | 10,181,166 | 1.7 |
| 2014 | 266,360 | 415,059 | 10,103,233 | 2.6 |
| 2019 | 281,876 | 465,885 | 9,729,107 | 2.9 |
| 2024 | 265,544 | 450,888 | 9,331,828 | 2.8 |
Note: Registered foreigners are Ministry of Justice counts on 31 December. MOIS foreign residents also include naturalized citizens and children of foreign residents. In South Korea as a whole there were 1,488,353 registered foreigners and 51,217,221 Korean residents in 2024, or 2.9 registered foreigners per 100 Korean residents.
Source: KIRD dataset, from Ministry of Justice immigration yearbooks and Ministry of the Interior and Safety statistics, 2006-2024.
Nationalities
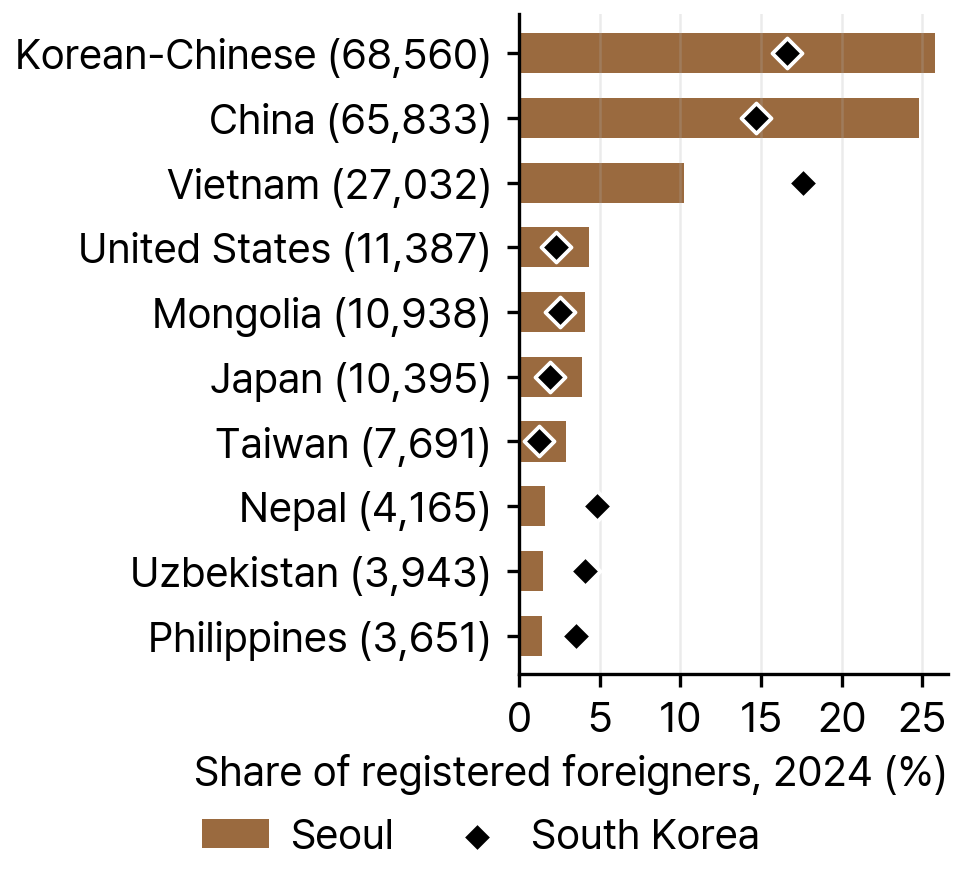
Korean-Chinese (68,560) and Chinese nationals (65,833) were the two largest groups of registered foreigners in Seoul in 2024 and together made up 50.6 percent of the total (see Figure 3 and Table 2). The Ministry of Justice reports Korean-Chinese, Chinese nationals of Korean ethnicity, separately from other Chinese nationals. Vietnamese nationals were third (27,032, or 10.2 percent), followed by nationals of the United States (11,387), Mongolia (10,938) and Japan (10,395). Korean-Chinese and Chinese nationals made up larger shares of registered foreigners in Seoul than in South Korea as a whole (25.8 and 24.8 percent, against 16.6 and 14.7 percent), and Vietnamese nationals a smaller share (10.2 percent, against 17.6 percent).
Source: KIRD dataset, from Ministry of Justice immigration yearbooks, 2024.
Between 2019 and 2024, the number of registered Korean-Chinese in Seoul fell from 115,637 to 68,560. The decline of 47,077 (40.7 percent) was larger than the net decline of 16,332 in all registered foreigners. The number of Chinese nationals changed little (66,053 in 2019). Mongolian nationals increased by 73.4 percent (from 6,307 to 10,938), Vietnamese nationals by 41.4 percent (from 19,122 to 27,032) and Nepali nationals from 1,353 to 4,165, while Taiwanese nationals decreased by 11.5 percent (from 8,687 to 7,691).
Table 2Ten Largest Nationalities among Registered Foreigners in Seoul, 2019 and 2024
| Nationality | 2019 | 2024 | Share of Seoul's registered foreigners, 2024 (%) | Seoul's share of the nationality's registered foreigners in South Korea, 2024 (%) |
|---|---|---|---|---|
| Korean-Chinese | 115,637 | 68,560 | 25.8 | 27.8 |
| China | 66,053 | 65,833 | 24.8 | 30.1 |
| Vietnam | 19,122 | 27,032 | 10.2 | 10.3 |
| United States | 9,636 | 11,387 | 4.3 | 32.6 |
| Mongolia | 6,307 | 10,938 | 4.1 | 29.0 |
| Japan | 8,696 | 10,395 | 3.9 | 37.1 |
| Taiwan | 8,687 | 7,691 | 2.9 | 44.2 |
| Nepal | 1,353 | 4,165 | 1.6 | 5.8 |
| Uzbekistan | 3,053 | 3,943 | 1.5 | 6.4 |
| Philippines | 3,484 | 3,651 | 1.4 | 7.0 |
Note: Korean-Chinese are Chinese nationals of Korean ethnicity, whom the Ministry of Justice reports separately from other Chinese nationals. Seoul accounted for 17.8 percent of all registered foreigners in South Korea in 2024.
Source: KIRD dataset, from Ministry of Justice immigration yearbooks, 2019 and 2024.
Seoul was home to 17.8 percent of all registered foreigners in South Korea in 2024 and to larger shares of several nationalities, including 44.2 percent of Taiwanese, 37.1 percent of Japanese, 32.6 percent of US and 30.1 percent of Chinese nationals. Its shares were larger still for Saudi nationals (81.9 percent, or 885 of 1,080), French nationals (66.1 percent, or 3,513 of 5,314), Spanish nationals (65.3 percent, or 780 of 1,194), Italian nationals (64.1 percent, or 827 of 1,291) and German nationals (63.2 percent, or 1,968 of 3,114).
Registered foreigners in Seoul came from 185 nationalities in 2024. The Shannon diversity index (H) of their nationalities, which rises as registered foreigners are spread more evenly across more nationalities, went from 1.6 in 2014 to 2.2 in 2024. On this index Seoul ranked 16th among the 17 provinces in 2024, where first is the most diverse.
Overseas Koreans on F-4 status report their residence instead of registering and are not counted among registered foreigners. In 2024, 147,773 F-4 holders reported a residence in Seoul, 26.7 percent of the 553,664 in South Korea. Most were Korean-Chinese (111,832), followed by nationals of the United States (20,838), Canada (7,348), Australia (2,149) and New Zealand (1,094). In Seoul, Korean-Chinese on F-4 status outnumbered registered Korean-Chinese (111,832 against 68,560), and US nationals on F-4 status outnumbered registered US nationals (20,838 against 11,387).
Residence Statuses
Study and job-search statuses (D-2, D-4 and D-10) covered 89,929 registered foreigners in Seoul in 2024, 33.9 percent of the total against 18.6 percent nationally, and settlement statuses (F-2, F-5 and F-6) covered 88,605, or 33.4 percent against 27.6 percent (see Figure 4). Rotation labor statuses covered 28,743 people (10.8 percent), about a third of the national share of 31.1 percent. The family group (F-1 and F-3) covered 21,538 (8.1 percent, against 10.0 percent nationally), skilled statuses (E-1 to E-7) 14,697 (5.5 percent, against 5.8 percent) and all other statuses 22,032 (8.3 percent, against 7.1 percent).
Source: KIRD dataset, from Ministry of Justice immigration yearbooks, 2024.
The student status (D-2) was the most common single status in Seoul in 2024, with 63,328 holders, 23.8 percent of the city's registered foreigners and 35.6 percent of all D-2 holders in South Korea (see Table 3). Permanent residence (F-5) followed with 51,045 holders and visiting employment (H-2) with 25,567, 27.8 percent of all H-2 holders in the country. H-2 holders made up 89.0 percent of Seoul's rotation labor group. The unclassified category (ETC), which covers statuses under the Status of Forces Agreement (SOFA) and treaties, included 9,502 people in Seoul, 30.0 percent of the national total in that category. E-7 (specially designated activities) was the largest skilled status, with 8,010 holders.
Table 3Ten Most Common Residence Statuses among Registered Foreigners in Seoul, 2024
| Status | Meaning | Registered foreigners | Share of Seoul's registered foreigners (%) | Seoul's share of all holders in South Korea (%) |
|---|---|---|---|---|
| D-2 | Student | 63,328 | 23.8 | 35.6 |
| F-5 | Permanent residence | 51,045 | 19.2 | 25.2 |
| H-2 | Visiting employment | 25,567 | 9.6 | 27.8 |
| F-6 | Marriage migration | 22,367 | 8.4 | 15.2 |
| D-4 | General trainee | 20,345 | 7.7 | 25.5 |
| F-2 | Residential | 15,193 | 5.7 | 24.9 |
| F-1 | Visiting cohabitation | 12,309 | 4.6 | 12.7 |
| ETC | Unclassified (SOFA and treaty statuses) | 9,502 | 3.6 | 30.0 |
| F-3 | Dependent family | 9,229 | 3.5 | 18.0 |
| E-7 | Specially designated activities | 8,010 | 3.0 | 12.7 |
Note: Seoul's share of all holders is the number of holders of each status in Seoul divided by the number of registered foreigners with that status in South Korea. The status groups are defined in the Definitions box.
Source: KIRD dataset, from Ministry of Justice immigration yearbooks, 2024.
The MOIS count classifies foreign residents in its own categories (see Table 4). Of the 450,888 foreign residents it recorded in Seoul in 2024, ethnic Koreans of foreign nationality (104,134) and international students (72,261) were the largest named categories of foreign nationals, ahead of foreign workers (37,734) and marriage migrants (34,368). The count also included 47,124 naturalized citizens and 36,473 children of foreign residents.
Table 4Foreign Residents in Seoul by MOIS Category, 2024
| Category | Foreign residents | Share of MOIS foreign residents (%) |
|---|---|---|
| Foreign workers | 37,734 | 8.4 |
| Marriage migrants | 34,368 | 7.6 |
| International students | 72,261 | 16.0 |
| Ethnic Koreans of foreign nationality | 104,134 | 23.1 |
| Other foreign nationals | 118,794 | 26.3 |
| Naturalized citizens | 47,124 | 10.5 |
| Children of foreign residents | 36,473 | 8.1 |
| Total | 450,888 | 100.0 |
Note: The first five categories are foreign nationals (367,291 in total).
Source: KIRD dataset, from Ministry of the Interior and Safety foreign-resident statistics, 2024.
Districts and Population-Decline Areas
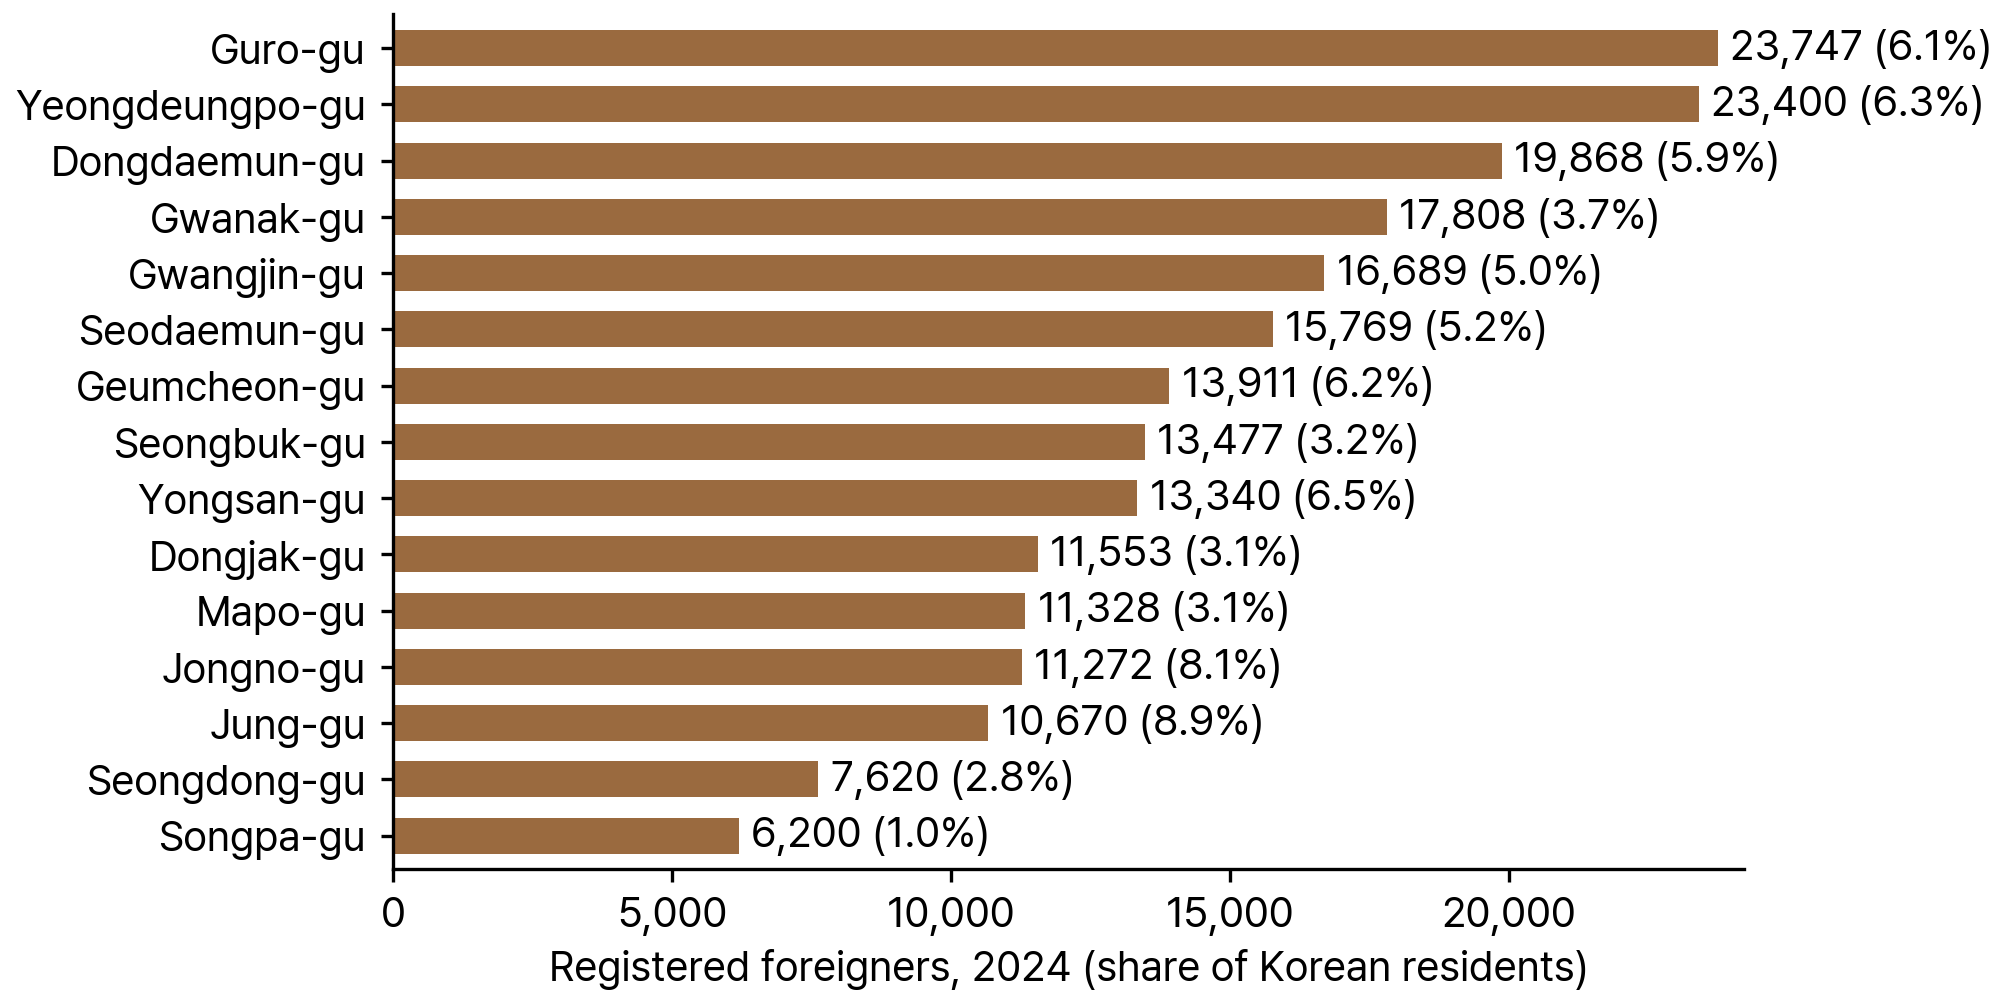
Guro-gu (23,747) and Yeongdeungpo-gu (23,400) had the most registered foreigners of Seoul's 25 districts (gu) in 2024, followed by Dongdaemun-gu (19,868), Gwanak-gu (17,808) and Gwangjin-gu (16,689) (see Figure 5 and Table 5). Relative to the Korean population, the ratio was highest in Jung-gu (8.9 registered foreigners per 100 Korean residents) and Jongno-gu (8.1), followed by Yongsan-gu (6.5), Yeongdeungpo-gu (6.3) and Geumcheon-gu (6.2), and lowest in Yangcheon-gu (0.8) and Dobong-gu (0.9).
Source: KIRD dataset, from Ministry of Justice immigration yearbooks and Ministry of the Interior and Safety resident registration statistics, 2024.
Between 2019 and 2024, the number of registered foreigners fell in 11 districts and rose in 14. The largest decreases were in Yeongdeungpo-gu (9,908 fewer), Guro-gu (8,960 fewer) and Geumcheon-gu (5,099 fewer), and together these southwestern districts lost 23,967 registered foreigners, more than the citywide net decrease of 16,332. The largest increases were in Dongdaemun-gu (3,039 more), Gangbuk-gu (2,036 more) and Seodaemun-gu (1,995 more). The Korean population fell in 22 districts and rose in Gangdong-gu (40,875 more), Gangnam-gu (12,176 more) and Yeongdeungpo-gu (6,095 more).
Table 5Ten Districts of Seoul with the Most Registered Foreigners, 2024
| District | Registered foreigners, 2024 | Registered foreigners per 100 Korean residents, 2024 | Change in Korean residents, 2019-24 | Change in registered foreigners, 2019-24 | Population-decline area |
|---|---|---|---|---|---|
| Guro-gu | 23,747 | 6.1 | −18,495 | −8,960 | No |
| Yeongdeungpo-gu | 23,400 | 6.3 | +6,095 | −9,908 | No |
| Dongdaemun-gu | 19,868 | 5.9 | −7,459 | +3,039 | No |
| Gwanak-gu | 17,808 | 3.7 | −22,282 | +568 | No |
| Gwangjin-gu | 16,689 | 5.0 | −19,387 | +1,067 | No |
| Seodaemun-gu | 15,769 | 5.2 | −6,544 | +1,995 | No |
| Geumcheon-gu | 13,911 | 6.2 | −7,651 | −5,099 | No |
| Seongbuk-gu | 13,477 | 3.2 | −21,090 | +1,383 | No |
| Yongsan-gu | 13,340 | 6.5 | −24,816 | −3,175 | No |
| Dongjak-gu | 11,553 | 3.1 | −20,164 | −1,396 | No |
Note: No district of Seoul was designated a population-decline area or an area of interest in 2021.
Source: KIRD dataset, from Ministry of Justice immigration yearbooks and Ministry of the Interior and Safety resident registration statistics, 2019 and 2024.
None of Seoul's 25 districts was among the population-decline areas or areas of interest that the Ministry of the Interior and Safety designated in October 2021, and none appears on the ministry's current lists (Ministry of the Interior and Safety, n.d.). For the city as a whole, the Korean population fell by 397,279 between 2019 and 2024 and registered foreigners fell by 16,332, so the change in registered foreigners offset none of the Korean decline. The foreign decline equaled 4.1 percent of the Korean decline (16,332 of 397,279).
By the definition used in this Spotlight, 12 districts in Seoul had an ethnic enclave in 2024. Korean-Chinese formed enclaves in Guro-gu (15,726 people, 66.2 percent of the district's registered foreigners, location quotient 8.4), Yeongdeungpo-gu (14,933; 63.8 percent; 8.3), Geumcheon-gu (9,133; 65.7 percent; 8.4) and Gwanak-gu (5,507; 30.9 percent; 2.4). Guro-gu, Yeongdeungpo-gu and Geumcheon-gu together had 39,792 registered Korean-Chinese, 58.0 percent of those in Seoul.
Chinese nationals formed enclaves in seven districts, the largest in Dongdaemun-gu (8,007; 40.3 percent; 5.5) and Seodaemun-gu (5,517; 35.0 percent; 4.3), followed by Gwangjin-gu (5,447; 32.6 percent; 3.8), Seongbuk-gu (4,362; 32.4 percent; 2.4), Jongno-gu (3,890; 34.5 percent; 6.6), Jung-gu (3,243; 30.4 percent; 6.3) and Seongdong-gu (2,479; 32.5 percent; 2.1). Together these districts had 32,945 registered Chinese nationals, half of those in Seoul (50.0 percent). Jungnang-gu had a Mongolian enclave (1,970; 32.4 percent; 7.1).
Population Trends
Seoul's Korean population rose from 10,181,166 in 2006 to 10,312,545 in 2010 and declined in every year from 2011 to 2024. It fell below 10 million in 2016 (9,930,616) and was 9,331,828 in 2024, 7.6 percent below the 2014 figure (771,405 fewer people) and 4.1 percent below the 2019 figure (397,279 fewer). Seoul accounted for 18.2 percent of South Korea's 51,217,221 Korean residents in 2024.
The Seoul Institute, using a different population series, reported that Seoul's registered population was 9.288 million in 2024, 0.5 percent below 2023 and 6.2 percent below the 9.907 million of 2015 (Seoul Institute, n.d.).
Seoul's total fertility rate was 0.58 in 2024, the lowest of the 17 provinces, against 0.75 nationally and 1.03 in Sejong and South Jeolla Province, the highest (Statistics Korea, 2025a).
People aged 65 and older made up 19.9 percent of Seoul's population in 2025, according to Statistics Korea figures reported by MBC News, below the national share of 20.3 percent, which exceeded 20 percent that year for the first time. The report named South Jeolla Province (27.4 percent), North Gyeongsang Province (26.1 percent), Gangwon State (25.7 percent), Jeonbuk State (25.4 percent) and Busan (24.5 percent) as the provinces with the highest shares, and Seoul, Gyeonggi Province (17 percent) and Incheon (18.2 percent) as those below 20 percent (MBC News, 2025).
Seoul was one of 12 provinces with net domestic out-migration in 2024 and had the third-highest rate of net out-migration. It had net inflows for job and education reasons and larger net outflows for housing and family reasons (Statistics Korea, 2025b).
Under the low scenario of Statistics Korea's 2022-2052 regional population projection, Seoul's population would fall from 9.42 million in 2022 to 7.22 million in 2052, a decrease of 2.2 million (23.3 percent). Under the medium scenario the decrease would be about 1.49 million, roughly 15 percent (Newspim, 2024).
Industry and Foreign Workers
A 2025 Newsis report based on Seoul city data describes Garibong-dong in Guro-gu, Siheung-dong in Geumcheon-gu, and Daerim-dong and Singil-dong in Yeongdeungpo-gu as traditional destinations for foreign workers in factories, industrial parks, garment sewing and manufacturing. The city's southwestern area was home to 102,954 of the 269,893 registered foreign residents in that count, the largest number of any area of the city (Newsis, 2025). According to the same report, the Imun-dong and Hwigyeong-dong neighborhoods of Dongdaemun-gu have many foreign workers in garment sewing and retail shops.
The report also found many American, Japanese and European professionals in Gangnam-gu (Samseong-dong, Yeoksam-dong and Apgujeong-dong) and Seocho-gu (Banpo-dong, Seocho-dong and Bangbae-dong), where international schools, foreign companies, embassies and international business facilities are concentrated (Newsis, 2025). In the KIRD data, Gangnam-gu had 5,870 registered foreigners in 2024 (1.1 per 100 Korean residents) and Seocho-gu 4,700 (1.2 per 100).
Registered foreigners on non-professional employment (E-9) status numbered 4,964 in Seoul in 2014, 3,442 in 2019, 2,684 in 2021 and 3,130 in 2024, when they made up 1.2 percent of the city's registered foreigners. Visiting employment (H-2) was the most common work status in Seoul in 2024, with 25,567 holders, 27.8 percent of all H-2 holders in South Korea. Skilled statuses (E-1 to E-7) covered 14,697 registered foreigners, including 8,010 on E-7 (specially designated activities) status.
The Ministry of Justice counted 6 registered foreigners on seasonal worker (E-8) status in Seoul on 31 December 2024. A count on that date misses most seasonal workers, whose contracts end before winter. Seoul is not named among the participating local governments in the Ministry of Agriculture, Food and Rural Affairs notice on the second-half 2025 allocation of seasonal workers, which put the 2025 total at 95,700 workers (86,633 in agriculture, 8,796 in fisheries and 271 in reserve) across about 100 local governments (Ministry of Agriculture, Food and Rural Affairs, 2025).
International Students and Universities
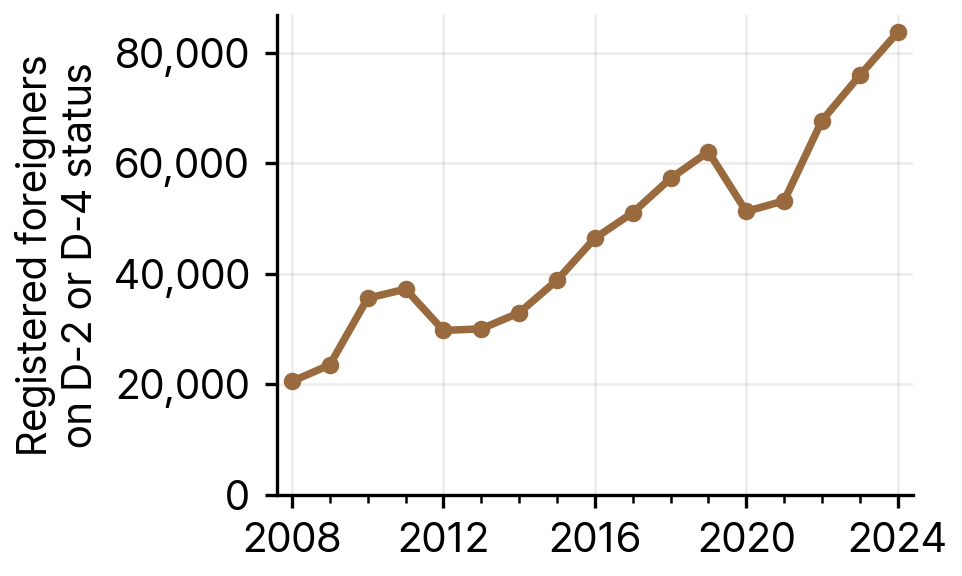
Registered foreigners on student (D-2) or general trainee (D-4) status in Seoul numbered 20,539 in 2008. The count rose to 37,229 in 2011, fell to 29,755 in 2012, grew every year to 62,081 in 2019, fell to 51,277 in 2020, and then grew every year to 83,673 in 2024, about four times the 2008 figure (see Figure 6). In 2024 these students and trainees made up 31.5 percent of Seoul's registered foreigners and 32.4 percent of all D-2 and D-4 holders in South Korea.
Source: KIRD dataset, from Ministry of Justice immigration yearbooks, 2008-2024.
Between 2019 and 2024 their number grew by 21,592 (34.8 percent), while registered foreigners on all other statuses fell from 219,795 to 181,871. The MOIS count, which uses its own categories, recorded 72,261 international students in Seoul in 2024.
Among universities in Seoul, Hanyang University had the most international students in 2023 (6,612), followed by Kyung Hee University (6,395), Sungkyunkwan University (5,472, counted across its campuses in Jongno-gu, Seoul, and in Suwon), Yonsei University (4,965) and Chung-Ang University (4,480), according to Korean Council for University Education data reported in 2024 (EToday, 2024a). The same data put about 45 percent of South Korea's 181,842 international students in 2023 at universities in Seoul. That share counts students by the location of their university in 2023; the KIRD share of 32.4 percent counts registered foreigners on D-2 or D-4 status by place of residence in 2024.
Provincial Policy
Seoul's support for foreign residents rests on the Seoul Metropolitan Government Ordinance on Support for Foreign Residents and Multicultural Families, enacted as Ordinance No. 5726 on 17 July 2014. The ordinance replaced a 2007 ordinance promoting Seoul as a global city and a 2009 ordinance on support for multicultural families. Its current text was last amended by Ordinance No. 7423 of 31 December 2019, part of a citywide revision of Japanese-style legal wording (Korea Law Information Center, n.d.).
In 2018, when the city's foreign resident population had grown to about 400,000, Seoul adopted the Da-Value Seoul Master Plan, with 4 goals, 14 major tasks and 100 projects, including a second Global Center scheduled to open in July 2018 (Seoul Metropolitan Government, 2018). The master plan for 2024-2028 allocates KRW 250.6 billion over five years to four areas (attracting and supporting talented foreigners, expanding foreign labor to match demand, stable settlement in local communities, and mutual respect and communication between Korean and foreign residents). Its targets include attracting 1,000 science and engineering talents at the master's and doctoral level and opening a second Seoul Foreign Residents Support Center in Seongdong-gu, in the city's northeast, to provide living information, employment training and specialized counseling (EToday, 2024b).
The city's Global City Policy Bureau lists 18 support facilities for foreign residents in five categories. They are the Seoul Global Center (38 Jongno, Jongno-gu; opened 1 January 2008), 7 Foreign Resident Centers, 7 Global Village Centers, the Global Youth Education Center (Yeongdeungpo-gu; opened 1 January 2022) and 2 facilities for migrant women affected by violence (Seoul Metropolitan Government, n.d.).
Because none of its districts is a population-decline area or an area of interest, Seoul is outside the Ministry of Justice's regional specialized visa pilot, whose eligibility depends on those designations (Ministry of the Interior and Safety, n.d.). The city operates its own metropolitan-type visa pilot for international students in science and engineering (D-2 and D-4, from associate and bachelor's to doctoral level) who begin their studies in 2026, aimed at future talent for its core industries of robotics, artificial intelligence, bio and fintech. Under the 2025 pilot, 10 participating universities recommend students, the city issues a recommendation letter, and the Ministry of Justice grants the visa or change of status. The universities are Kookmin University, Seoul National University of Science and Technology, the Seoul School of Integrated Sciences and Technologies (aSSIST, a graduate business school), the University of Seoul, Seoul National University, Seoul Women's University, Sungshin Women's University, Sejong University, Soongsil University and Chung-Ang University (Sungshin Women's University, 2026).
Seoul also conducts the annual Seoul Survey, a nationally approved statistic (No. 201011). Its 2024 round surveyed 2,500 foreign residents of Seoul aged 20 or older with more than 90 days of residence, alongside 20,000 households and 5,000 citizens (Seoul Metropolitan Government, 2024).
Languages
The KIRD dataset estimates the first languages of registered foreigners by applying each country's first-language shares from Ethnologue to the counts of registered foreigners by nationality. By this estimate, registered foreigners in Seoul in 2024 included 69,050 first-language speakers of Chinese, 23,226 of Vietnamese, 13,735 of English, 10,198 of Japanese and 9,604 of Mongolian (see Table 6). In total, 21 languages had at least 1,000 estimated speakers in Seoul in 2024.
Table 6Ten Most Common Estimated First Languages among Registered Foreigners in Seoul, 2024
| Language | Estimated first-language speakers |
|---|---|
| Chinese | 69,050 |
| Vietnamese | 23,226 |
| English | 13,735 |
| Japanese | 10,198 |
| Mongolian | 9,604 |
| Cantonese | 5,293 |
| Russian | 4,345 |
| Spanish | 3,834 |
| French | 3,648 |
| Tagalog/Filipino | 3,442 |
Note: Estimates apply Ethnologue first-language shares for each country to the counts of registered foreigners by nationality.
Source: KIRD dataset, from Ministry of Justice immigration yearbooks and Ethnologue first-language shares, 2024.
The estimates exclude Korean, and they do not cover the 68,560 registered Korean-Chinese in Seoul, for whom the dataset has no first-language shares.
Service Organizations and Community Places
The KIRD census of 1,720 migrant-serving organizations in South Korea includes 305 in Seoul (17.7 percent), or 11.5 per 10,000 registered foreigners in 2024, close to the national rate of 11.6. Of the 305, 284 provide services directly to migrants. The largest types are providers of social integration and early adaptation programs (81), civic and faith-based support organizations (67), medical support institutions (30), migrant community organizations (23) and foreign resident support centers (20). The census also includes 25 family centers in Seoul.
Organizations in the census list the groups they serve, and one organization can list several. In Seoul, 98 list migrant workers, 69 families, 64 refugees, 33 youth, 21 children, 21 overseas Koreans, 19 women, 15 undocumented migrants and 8 international students, and 46 serve all migrants.
Daerim-dong in Yeongdeungpo-gu, known as Seoul's Chinatown, has about 45,000 residents, more than 60 percent of whom are Korean-Chinese or Chinese nationals, the highest concentration of any ethnic enclave in Korea according to Seoul Metropolitan Government population data (Korea JoongAng Daily, 2026).
The Seoul Central Mosque, Korea's first mosque, was built in 1976 in Hannam-dong, Yongsan-gu, near Itaewon (Korea Herald, 2026). A 2020 city report described a Filipino market open every Sunday from 10 a.m. to 5 p.m. in front of Hyehwa-dong Catholic Church in Jongno-gu, which began as the number of Filipinos in the area grew (Seoul Metropolitan Government, 2020).
Seorae Village in Seocho-gu (Banpo 4-dong and parts of Bangbae-dong) became a French residential area after the Seoul French School moved there from Hannam-dong, and more than 40 percent of the French nationals in Korea live there (Ilyo Seoul, 2023). In the KIRD data, 3,513 of the 5,314 registered French nationals in South Korea lived in Seoul in 2024.
Sources
Korea Immigration Regional Dashboard (KIRD). 2026. Spatiotemporal administrative dataset of nationality, residential diversity, and language demand among immigrants in South Korea, 2006-2024. openICPSR. https://doi.org/10.3886/E249944V1
Korea Law Information Center. n.d. Seoul Metropolitan Government Ordinance on Support for Foreign Residents and Multicultural Families (서울특별시 외국인주민 및 다문화가족 지원 조례), Ordinance No. 5726 of 17 July 2014, as amended by Ordinance No. 7423 of 31 December 2019. https://law.go.kr/LSW/ordinInfoP.do?ordinSeq=1447701
Seoul Metropolitan Government. 2018. Da-Value Seoul Master Plan for 400,000 foreign residents (in Korean). https://news.seoul.go.kr/welfare/archives/125225
EToday. 2024b. Mayor Oh Se-hoon announces foreign resident policy master plan for future urban competitiveness (in Korean). https://www.etoday.co.kr/news/view/2361371
Seoul Metropolitan Government. n.d. Foreign resident support facilities in Seoul (in Korean). https://news.seoul.go.kr/welfare/archives/144416
Ministry of the Interior and Safety. n.d. Designation of population-decline areas (in Korean). https://www.mois.go.kr/frt/sub/a06/b06/populationDecline/screen.do
Sungshin Women's University, Office of International Affairs. 2026. The key for global talent coming to Seoul, the metropolitan-type visa (in Korean). https://www.sungshin.ac.kr/bbs/main_eng/5005/150760/artclView.do
Ministry of Agriculture, Food and Rural Affairs. 2025. 22,731 more foreign seasonal workers allocated for the second half of 2025 (in Korean). https://www.mafra.go.kr/bbs/home/792/574502/artclView.do
Seoul Metropolitan Government. 2024. 2024 Seoul Survey (in Korean). https://news.seoul.go.kr/gov/archives/561350
Newsis. 2025. Seoul's registered foreigners near 270,000, with distinct residential patterns by area (in Korean). https://www.newsis.com/view/NISX20251001_0003352145
The Seoul Institute. n.d. Notable facts about Seoul in 2024, population change (in Korean). https://data.si.re.kr/node/65434
Statistics Korea, via Korea.kr policy briefing. 2025a. 2024 birth and death statistics, provisional (in Korean). https://www.korea.kr/briefing/policyBriefingView.do?newsId=156676180
MBC News. 2025. Population aged 65 and older passes 10 million this year, 20 percent of the total (in Korean). https://imnews.imbc.com/news/2025/society/article/6760907_36718.html
Statistics Korea, via Korea.kr policy briefing. 2025b. 2024 domestic migration statistics (in Korean). https://www.korea.kr/briefing/policyBriefingView.do?newsId=156672078
Newspim. 2024. Seoul's population to fall by 2.2 million in 30 years, with only Sejong and Gyeonggi growing (in Korean). https://www.newspim.com/news/view/20240528000318
EToday. 2024a. Universities with the most international students are Hanyang, Kyung Hee and Sungkyunkwan (in Korean), citing Korean Council for University Education data for 2023. https://www.etoday.co.kr/news/view/2373103
Korea JoongAng Daily. 2026. Behind the prejudice, Daerim-dong's Chinese community rooted in the middle of Seoul (in Korean and English). https://www.koreajoongangdaily.com/bilingual-news/pyeongyeonui-imyeon-seoul-hanbogpane-ppulinaelin-daelimdong-junggugin-gongdongche/12729517
Seoul Metropolitan Government, Mediahub. 2020. A distinctive market in Hyehwa-dong every Sunday (in Korean). https://mediahub.seoul.go.kr/archives/1287701
Park, Yuna. 2026. One last goodbye to old Hannam before 6,000 homes rise. Korea Herald. https://www.koreaherald.com/article/10878727
Kim, Jeong-a. 2023. Seocho-gu's Little France, Seorae Village (서초구의 작은 프랑스 '서래마을') (in Korean). Ilyo Seoul. https://www.ilyoseoul.co.kr/news/articleView.html?idxno=479523
Suggested citation: Korea Immigration Regional Dashboard (KIRD). 2026. “Foreign Residents in Seoul.” Foreign Residents in South Korea series, September 2026. Data: Korea Immigration Regional Dashboard (KIRD) dataset, https://doi.org/10.3886/E249944V1. Interactive maps and tables: https://immigrantsinkorea.today.