 Korea Immigration Regional Dashboard
SpotlightSeptember 2026Nationality profilesDownload PDF
American Immigrants in South Korea
Highlights
- At the end of 2024, Americans were the 12th-largest nationality among registered foreigners in South Korea (34,886 people, 2.3 percent) and the fifth-largest among all resident foreigners (170,251 people, 6.4 percent), up from 108,097 resident foreigners in 2006.
- In 2024, 51,177 Americans (30.1 percent of the group) held the F-4 Overseas Korean visa, and Americans held 44.9 percent of all E-2 foreign language instructor visas in the country.
- Between 2011 and 2024, 23,351 people whose previous nationality was American restored their Korean nationality, compared with 87 Americans who naturalized between 2014 and 2024.
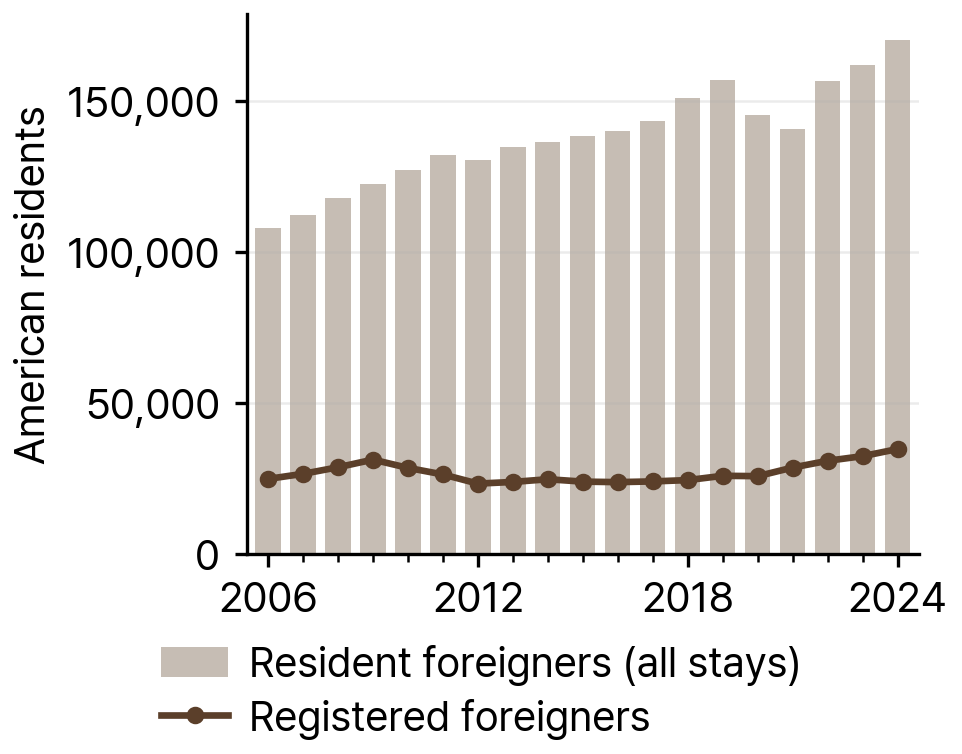
The Ministry of Justice counted 108,097 American resident foreigners in South Korea at the end of 2006 and 170,251 at the end of 2024, an increase of 62,154 people (57.5 percent). In 2024, Americans were the 12th-largest nationality among registered foreigners, the long-term residents who complete alien registration (34,886 people, 2.3 percent of all registered foreigners), and the fifth-largest among all resident foreigners (6.4 percent). In 2014 they ranked 10th among registered foreigners and third among all resident foreigners. Only 20.5 percent of American resident foreigners were registered in 2024: the 51,177 F-4 holders report their residence instead of registering, and the 39,684 B-2 holders are short-term visitors.
Most Americans in Korea hold statuses tied to Korean ancestry, short visits, or teaching. The F-4 Overseas Korean visa, open to former Korean nationals and their descendants, was the most common status in 2024 (51,177 holders), followed by B-2 tourist and transit status (39,684). The number of B-2 holders more than doubled from 18,428 in 2014, while holders of the E-2 foreign language instructor visa fell from 9,295 in 2014 to 6,032 in 2024.
Compared with all resident foreigners in 2024, Americans were more likely to be children under 15 (13.1 percent versus 5.7 percent) or aged 60 and older (18.1 percent versus 12.9 percent), and registered Americans were more concentrated in Seoul, Incheon, and Gyeonggi (71.3 percent versus 55.2 percent). Only 5.3 percent held an employment visa, against 19.2 percent of all resident foreigners. This Spotlight describes the number of American residents over time, where they live, their age and sex, visa status, migration channels, naturalization, and community organizations.
Size of the Population over Time
The number of American resident foreigners grew from 108,097 in 2006 to 156,983 in 2019. It fell to 145,580 in 2020 and 140,672 in 2021, then rose to 156,562 in 2022, 161,895 in 2023, and 170,251 in 2024, the highest count in the series. Among all resident foreigners, Americans ranked third in 2006 and 2014 and fifth in 2019 and 2024, and their share of the total fell from 11.9 percent in 2006 to 6.4 percent in 2024 (KIRD dataset).
Registered foreigners are a much smaller group. In 2024, 34,886 Americans were registered, 20.5 percent of all American resident foreigners, compared with 24,998 registered in 2006 and 26,025 in 2019. Among registered foreigners, Americans ranked sixth in 2006, 10th in 2014, 11th in 2019, and 12th in 2024, and they made up 4.0 percent of all registered foreigners in 2006 and 2.3 percent in 2024.
Source: KIRD dataset, from Ministry of Justice immigration yearbooks, 2006-2024.
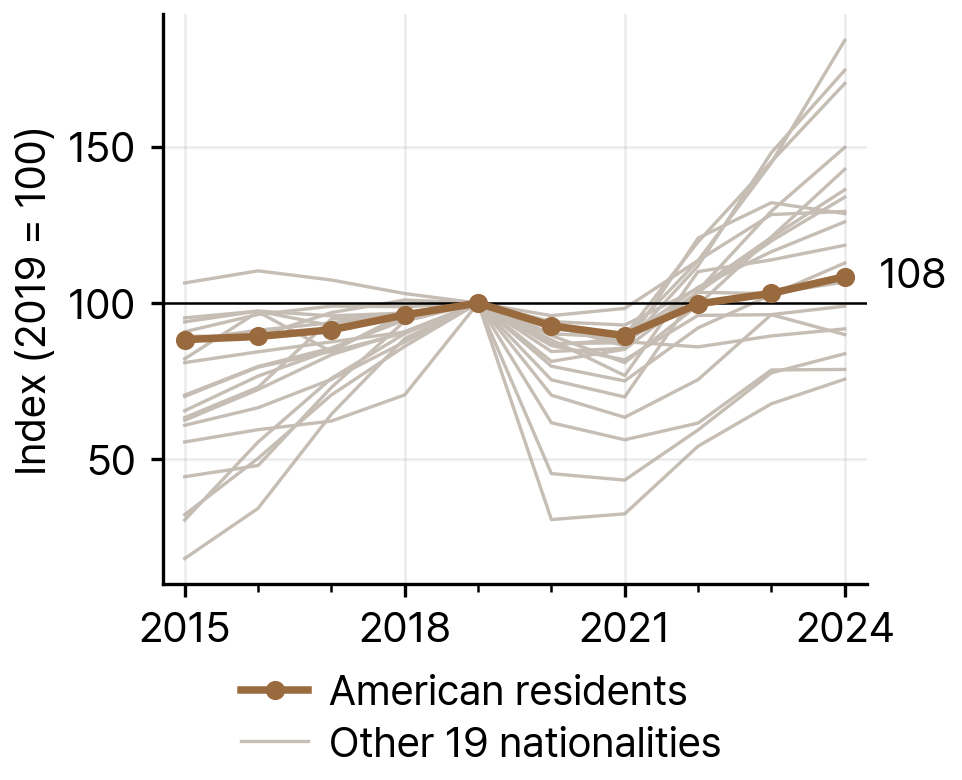
Measured against 2019, the American population stood at an index of 108.5 in 2024 (170,251 divided by 156,983). This ranked 13th in growth among the 20 largest nationalities.
Source: KIRD dataset, from Ministry of Justice immigration yearbooks, 2006-2024.
Table 1American Resident Foreigners and Registered Foreigners in South Korea, Selected Years
| Year | Resident foreigners | Registered foreigners | Rank among resident foreigners | Rank among registered foreigners | Share of all resident foreigners (%) | Share of all registered foreigners (%) |
|---|---|---|---|---|---|---|
| 2006 | 108,097 | 24,998 | 3 | 6 | 11.9 | 4.0 |
| 2014 | 136,663 | 24,890 | 3 | 10 | 7.6 | 2.3 |
| 2019 | 156,983 | 26,025 | 5 | 11 | 6.2 | 2.0 |
| 2024 | 170,251 | 34,886 | 5 | 12 | 6.4 | 2.3 |
Note: Resident foreigners are counted on 31 December and include short-term visitors and F-4 holders who report their residence. Registered foreigners are those in Korea for more than 90 days who completed alien registration. Ranks are among all nationalities on each basis.
Source: KIRD dataset, from Ministry of Justice immigration yearbooks, 2006-2024.
Distribution by Province and District
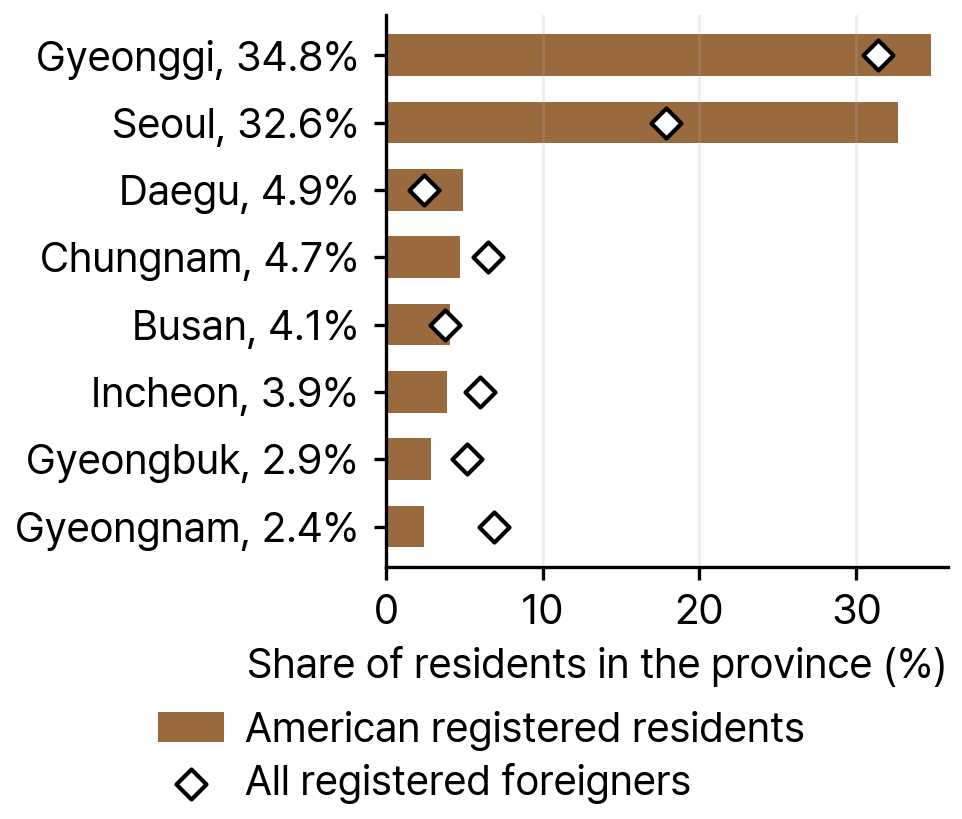
District data cover the 34,886 Americans who were registered foreigners in 2024. Of these, 38.7 percent (13,498) lived in Incheon and Gyeonggi, 32.6 percent (11,387) in Seoul, 14.8 percent (5,169) in the Yeongnam region, 7.7 percent (2,680) in Chungcheong, 3.2 percent (1,102) in Gangwon and Jeju, and 3.0 percent (1,050) in Honam. Together, Seoul, Incheon, and Gyeonggi accounted for 71.3 percent of registered Americans, compared with 55.2 percent of all registered foreigners.
Few Americans live in rural counties (gun). In 2024, 3.3 percent of registered Americans lived in a county, compared with 10.6 percent of all registered foreigners.
Source: KIRD dataset, from Ministry of Justice registered-foreigner statistics by district, 2024.
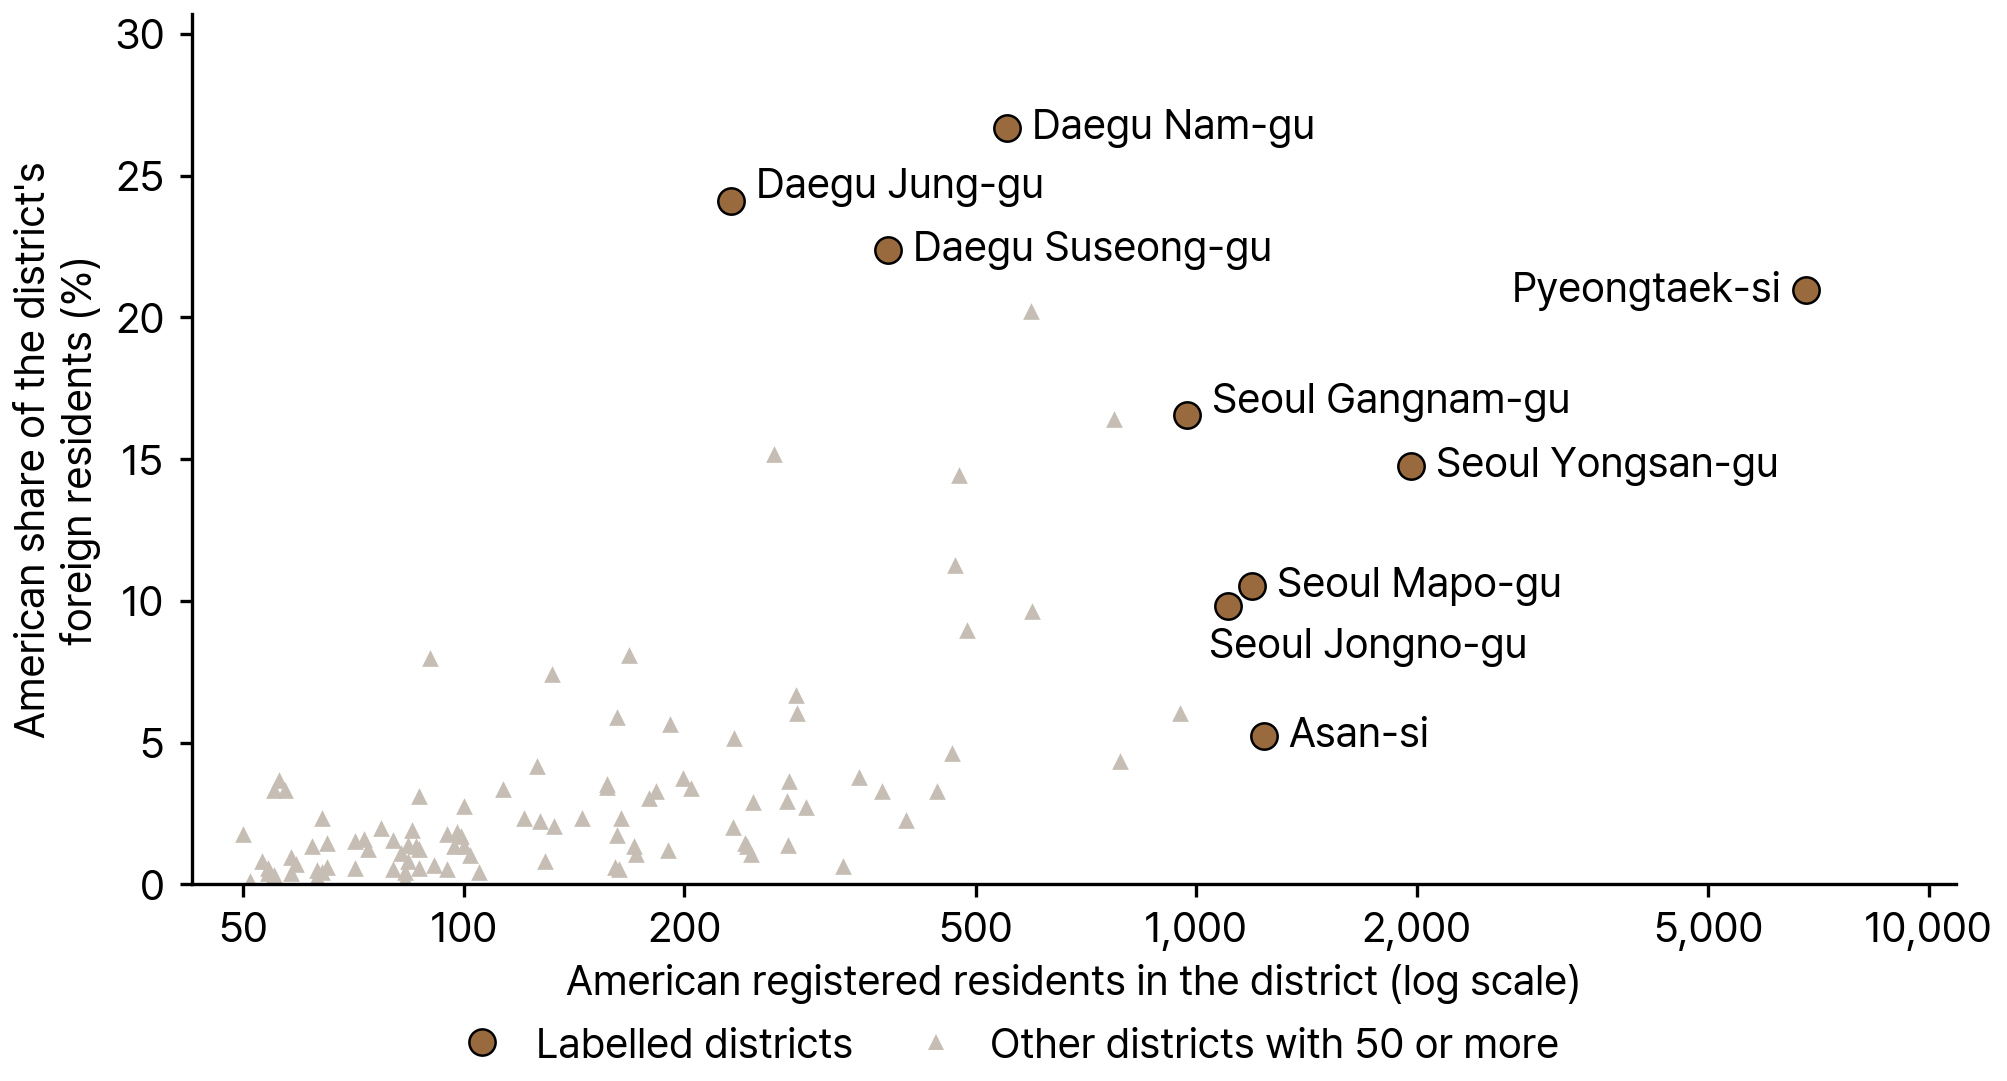
Pyeongtaek-si in Gyeonggi-do had the largest number of registered Americans in 2024 (6,812), 21.0 percent of the city's registered foreigners. Seoul's Yongsan-gu followed with 1,967, then Asan-si in Chungcheongnam-do with 1,236. The ten largest districts accounted for 47.0 percent of registered Americans, and 64 districts had at least 100.
Americans made up their largest shares of the foreign population in three Daegu districts: 26.7 percent in Nam-gu (551 people), 24.1 percent in Jung-gu (232), and 22.4 percent in Suseong-gu (379). They also made up 20.2 percent of registered foreigners in Bundang-gu, Seongnam-si (595).
Source: KIRD dataset, from Ministry of Justice registered-foreigner statistics by district, 2024.
Table 2Ten Districts with the Most Registered American Foreigners, 2024
| District | Province | Registered Americans | Share of district's registered foreigners (%) |
|---|---|---|---|
| Pyeongtaek-si | Gyeonggi-do | 6,812 | 21.0 |
| Seoul Yongsan-gu | Seoul | 1,967 | 14.7 |
| Asan-si | Chungcheongnam-do | 1,236 | 5.2 |
| Seoul Mapo-gu | Seoul | 1,193 | 10.5 |
| Seoul Jongno-gu | Seoul | 1,107 | 9.8 |
| Seoul Gangnam-gu | Seoul | 971 | 16.5 |
| Seoul Seodaemun-gu | Seoul | 951 | 6.0 |
| Incheon Yeonsu-gu | Incheon | 786 | 4.3 |
| Seoul Seocho-gu | Seoul | 772 | 16.4 |
| Seoul Songpa-gu | Seoul | 597 | 9.6 |
Note: Registered foreigners only; F-4 holders who report residence are not included.
Source: KIRD dataset, from Ministry of Justice registered-foreigner statistics by district, 2024.
The index of dissimilarity (D), which measures how differently Americans and all other registered foreigners are spread across districts, rose from 0.352 in 2014 to 0.499 in 2024. A value of 0.499 means that about half of registered Americans would have to move to another district to match the distribution of other foreigners. No district met the KIRD definition of an ethnic enclave in 2024 (a location quotient of at least 2 and Americans making up at least 30 percent of the district's registered foreigners).
Age and Sex
Women made up 44.0 percent of American resident foreigners in 2024 (74,946 of 170,251), up from 42.2 percent in 2019 and close to the 45.1 percent among all resident foreigners.
The American population has more children and more older adults than the foreign population overall. In 2024, 13.1 percent were under age 15, against 5.7 percent of all resident foreigners, and 18.1 percent were aged 60 and older, against 12.9 percent. Adults aged 20 to 39 made up 38.9 percent of Americans and 49.7 percent of all resident foreigners. The largest age group among Americans was 60 and older, and the median fell in the 35 to 39 group.
Between 2019 and 2024, the number of Americans aged 50 and older rose from 41,135 to 52,021, and the number aged 20 to 39 fell from 70,099 to 66,162. Children under 5 fell from 9,529 to 6,338.
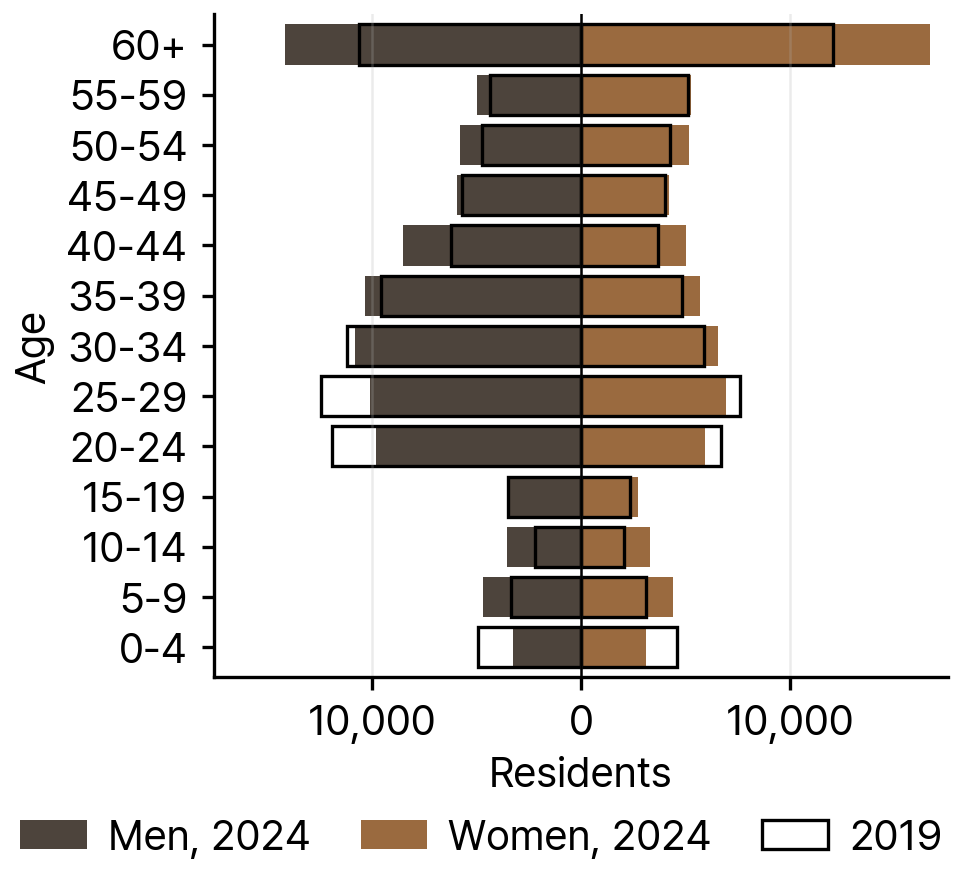
Source: KIRD dataset, from Ministry of Justice immigration yearbooks, 2006-2024.
Visa Status
In 2024, 30.1 percent of Americans held the F-4 Overseas Korean visa (51,177 people), and Americans were the second-largest nationality among F-4 holders. Another 23.3 percent (39,684) held B-2 tourist and transit status, and Americans accounted for 25.9 percent of all B-2 holders in Korea.
Americans held 6,032 E-2 foreign language instructor visas in 2024, 44.9 percent of all E-2 holders in the country, down from 7,219 in 2019 and 9,295 in 2014. Marriage migrant (F-6) holders rose from 3,280 in 2019 to 4,743 in 2024, and permanent residents (F-5) from 1,171 to 1,815.
Grouped by purpose, 5.3 percent of Americans held employment visas in 2024 (19.2 percent of all resident foreigners), 5.1 percent held marriage or family visas (13.6 percent), 1.5 percent held study or training visas (10.2 percent), and 1.1 percent held permanent residence (7.7 percent). Statuses outside these groups made up 33.4 percent of Americans, compared with 5.2 percent of all resident foreigners.
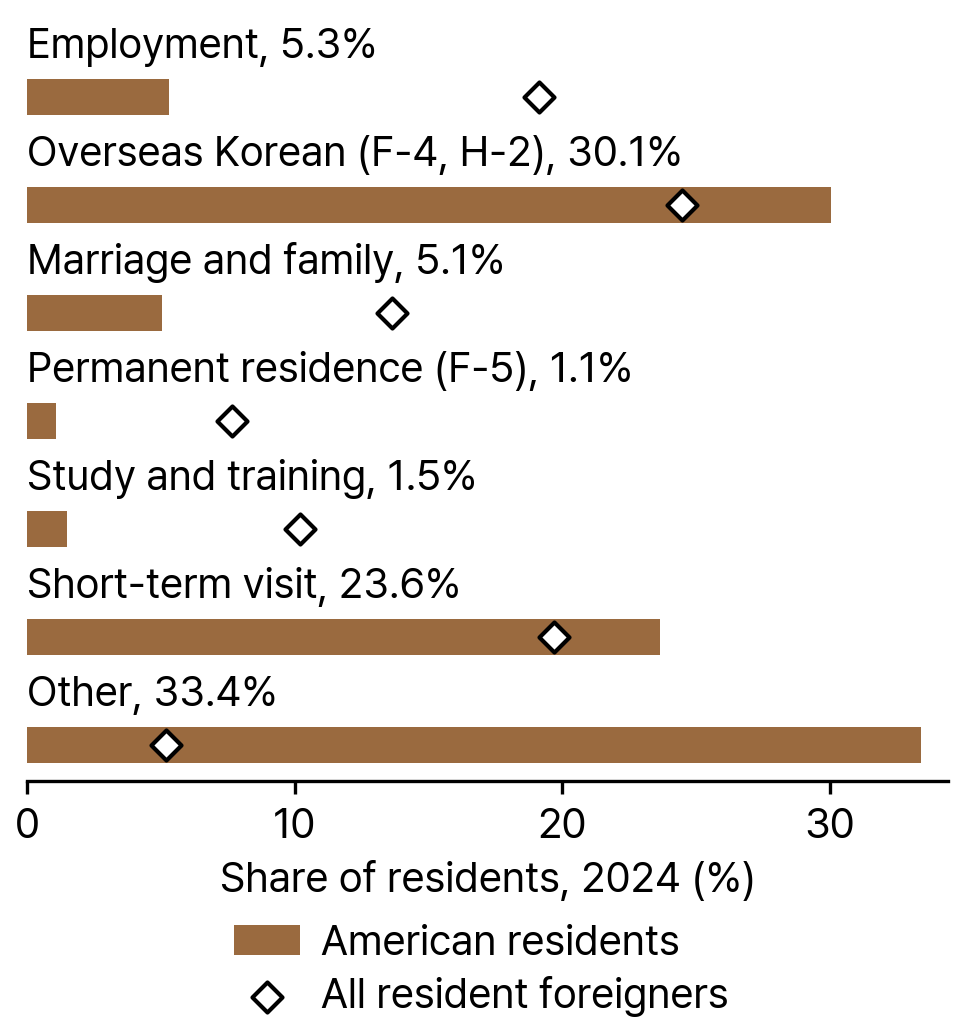
Source: KIRD dataset, from Ministry of Justice immigration yearbooks, 2024.
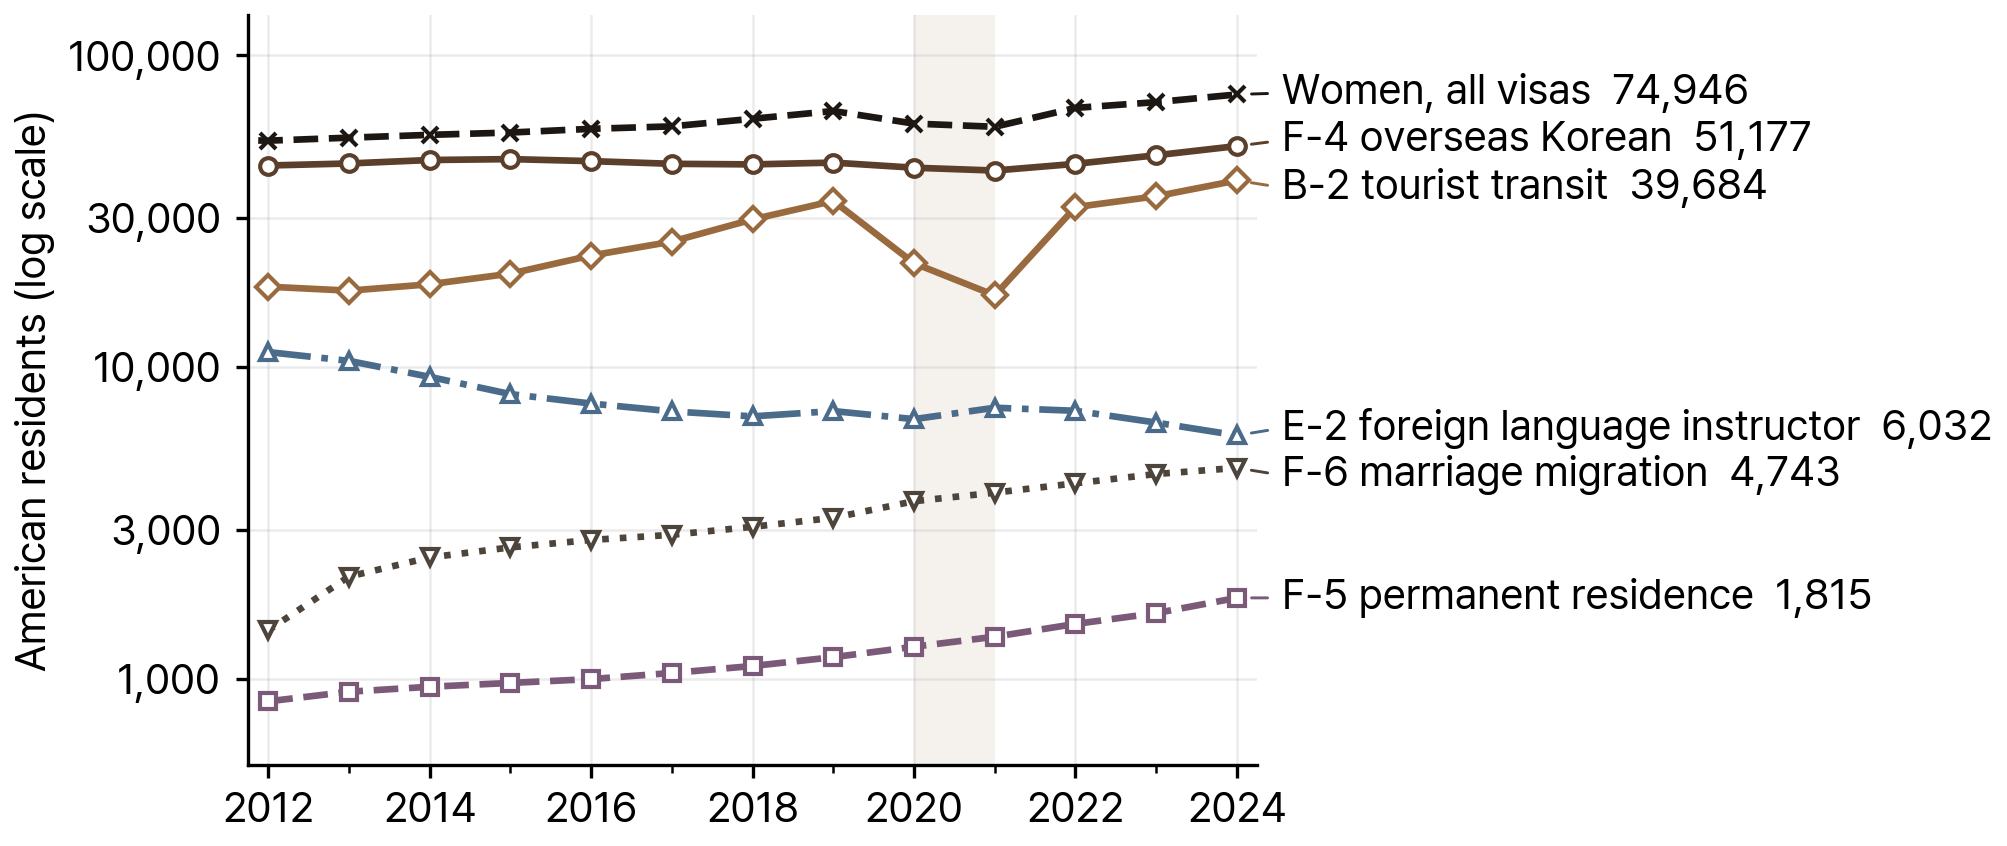
Source: KIRD dataset, from Ministry of Justice immigration yearbooks, 2006-2024.
Table 3Most Common Visas Held by American Resident Foreigners, 2019 and 2024
| Visa | Meaning | 2019 | 2024 | Share of Americans, 2024 (%) | Americans' share of all holders of the visa, 2024 (%) |
|---|---|---|---|---|---|
| F-4 | Overseas Korean | 45,291 | 51,177 | 30.1 | 9.2 |
| B-2 | Tourist Transit | 34,118 | 39,684 | 23.3 | 25.9 |
| E-2 | Foreign Language Instructor | 7,219 | 6,032 | 3.5 | 44.9 |
| F-6 | Marriage Migration | 3,280 | 4,743 | 2.8 | 3.2 |
| F-5 | Permanent Residence | 1,171 | 1,815 | 1.1 | 0.9 |
| D-2 | Student | 1,243 | 1,712 | 1.0 | 1.0 |
| F-3 | Dependent Family | 1,666 | 1,700 | 1.0 | 3.2 |
Note: Shares of Americans use the 2024 total of 170,251 American resident foreigners. The seven visas shown account for 106,863 people (62.8 percent).
Source: KIRD dataset, from Ministry of Justice immigration yearbooks, 2006-2024.
Migration Channels and Policy
The largest channel is the F-4 Overseas Korean visa. American citizens who previously held Korean nationality, and their descendants, qualify; since July 2, 2019, eligibility has extended to the fourth generation and beyond. The F-4 is a five-year multiple-entry visa under which each entry may last up to two years (Embassy of the Republic of Korea in the USA, 2019).
For short visits, US citizens are among the nationals of 22 countries and regions exempted since April 1, 2023, from Korea's K-ETA electronic travel authorization for tourism or business visits of 90 days or less. The government tied the exemption to the recovery of tourism after COVID-19 and has extended it through December 31, 2026 (Fragomen, 2023).
The E-2 foreign language instructor visa is limited to citizens of seven countries (the United States, the United Kingdom, Canada, South Africa, New Zealand, Australia, and Ireland) who hold a bachelor's degree from a university in one of those countries. Applicants also submit an officially verified criminal background check and a health certificate (KOWORK Visa Center, n.d.). The United States is not one of the 17 countries with an Employment Permit System agreement with Korea, so Americans have no access to the E-9 low-skilled work visa (Seoulstart, 2026).
Rules for E-2 teachers have changed over time. Effective July 3, 2017, Korea dropped the mandatory HIV test that E-2 holders had to pass to renew the visa, retaining mandatory drug and syphilis tests, after criticism that the HIV requirement was discriminatory (Korea Times, 2017). The change followed a May 2015 opinion of the UN Committee on the Elimination of Racial Discrimination in a case brought by a New Zealand English teacher in Korea; a Seoul court awarded her $27,000 for wrongful termination in 2019 (Wagner, 2021).
US military personnel and their families come to and live in Korea under the Status of Forces Agreement (SOFA), a category legally separate from ordinary residence visas. SOFA status covers people in Korea for the US military mission and does not by itself permit off-base employment without a Korean work visa (51st Force Support Squadron, Osan Air Base, n.d.). About 28,500 US service members were stationed in Korea in 2025 (Korea Times, 2025). To our knowledge, no published source states whether SOFA personnel are included in the Ministry of Justice counts used here.
Naturalization
Few Americans naturalize in Korea. Between 2014 and 2024, 87 Americans acquired Korean nationality through naturalization; annual numbers ranged from 5 (2018) to 12 (2022), with 7 in 2024. The Ministry of Justice's by-country table reports this combined naturalization total from 2014; the 2009 and 2010 yearbook editions instead publish cumulative totals since 1991, so this Spotlight does not use them.
Restoration of nationality is far more common. Former Korean nationals who had taken US citizenship can apply to restore Korean nationality, and 23,351 people whose previous nationality was American did so between 2011 and 2024, including 2,298 in 2024. This restoration total is about 268 times the 87 naturalizations recorded between 2014 and 2024 (23,351 divided by 87).
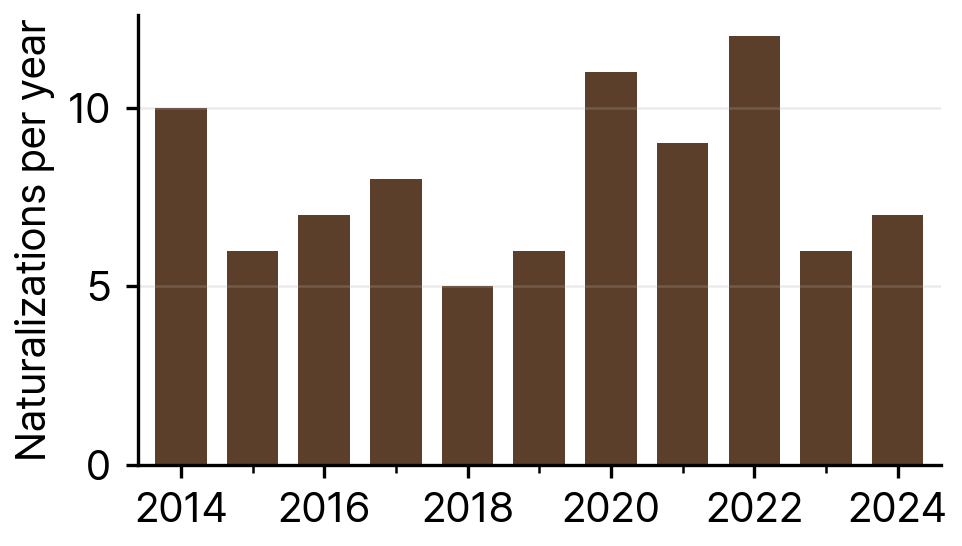
Source: KIRD dataset, from Ministry of Justice immigration yearbooks, 2014-2024.
Unauthorized Residents
Americans are not among the ten nationalities that the Ministry of Justice immigration yearbook (table 6-4) reports separately, so no count of unauthorized American residents is published. The yearbook counted 397,522 unauthorized residents of all nationalities in 2024.
Health and Well-being
As far as we know, neither published studies (in OpenAlex or on the web, in English or Korean) nor government statistics on occupational injury and health care use report the health or well-being of American residents in Korea separately from other nationalities.
Migration from the United States to South Korea
In the Ministry of Justice monthly statistics for December 2025, 180,230 US nationals were resident foreigners in South Korea, 6.5 percent of the total and the third-largest nationality after China and Vietnam (Seoulstart 2025). The monthly report groups nationalities differently from the KIRD dataset, which lists Korean-Chinese separately from other Chinese nationals and ranked Americans fifth among resident foreigners in 2024.
No official count of Americans living abroad exists. The State Department's 2016 figure of 9 million is no longer used, and independent estimates range from about 4.4 million (Federal Voting Assistance Program, 2022) to 5.5 million (Association of Americans Resident Overseas, 2023) (Greenback Tax Services 2024). Measured against those two estimates, the 180,230 Americans in Korea in December 2025 equal about 3.3 to 4.1 percent of Americans abroad. We know of no published source that reports where Korea ranks among the destinations of Americans abroad.
Much of the movement from the United States to Korea draws on the Korean diaspora. The Overseas Koreans Agency counted 2,557,047 overseas Koreans in the United States on 31 December 2024, 36.49 percent of the 7,006,703 overseas Koreans worldwide (Overseas Koreans Agency 2025). This population, which includes former Korean nationals and their descendants, is the pool eligible for the F-4 Overseas Korean visa. No published source appears to break down Korea-bound Americans by US state or region.
Teaching is the main work channel. Korea issued 1,286 E-2 foreign language instructor visas to all eligible nationalities in the first quarter of 2026, 47.5 percent fewer than the 2,448 issued in the first quarter of 2020 and the lowest figure in six years; the newspaper that reported the figures attributed the decline to a shrinking private academy (hagwon) market and the spread of AI language-learning tools (Korea JoongAng Daily 2026). That source does not report American teachers separately. Because the United States is not an Employment Permit System sending country, there are no EPS applicant or quota figures for Americans.
Under the working holiday agreement between Korea and the United States, up to 2,000 Americans aged 18 to 30 may participate each year. The United States is the only partner country whose participants must be post-secondary students or graduates within one year of graduation, with proof of status from their institution (Working Holiday Info Center 2026). On the US side, the House of Representatives passed its version of the FY2026 National Defense Authorization Act on 10 September 2025, which called for maintaining about 28,500 US troops in Korea (Korea Times 2025).
Personal remittances received equaled 0.0 percent of US GDP in 2025, 181st of 185 economies, and 0.4 percent of Korean GDP (Statistics of the World 2025a; Statistics of the World 2025b). Both figures come from a secondary compilation of World Bank World Development Indicators. We are not aware of a published figure for remittances from Americans in Korea to the United States, and the World Bank's bilateral remittance matrix, the usual source for flows between pairs of countries, has not been updated since its 2021 edition.
Table 4Migration Indicators, United States and South Korea
| Indicator | Value | Source |
|---|---|---|
| US nationals resident in South Korea, December 2025 | 180,230 (6.5% of resident foreigners) | Seoulstart 2025 |
| US citizens living abroad, independent estimates, 2022 and 2023 | 4.4 million to 5.5 million | Greenback Tax Services 2024 |
| Overseas Koreans living in the United States, 31 December 2024 | 2,557,047 (36.49% of all overseas Koreans) | Overseas Koreans Agency 2025 |
| E-2 visas issued, all nationalities, first quarter of 2020 and 2026 | 2,448 and 1,286 | Korea JoongAng Daily 2026 |
| Working holiday quota for Americans, per year | 2,000 | Working Holiday Info Center 2026 |
| EPS applicants and places | Not applicable (not an EPS sending country) | Seoulstart 2026 |
| Personal remittances received, % of GDP, 2025 | United States 0.0; South Korea 0.4 | Statistics of the World 2025a; 2025b |
Note: Figures on E-2 visas cover all eligible nationalities; the source does not report Americans separately.
Source: Sources as listed in each row.
Research on Americans who move to Korea centers on return and race. In 56 interviews with US-raised Korean Americans who relocated to Korea, Suh (2019) found that their wish to move was tied to their racialization and ethnic identity formation as racial minorities in the United States, which reinforced existing desires to return. Kim (2012) studied adult Korean adoptees, most raised in Western countries including the United States, who lived and worked in Korea for extended periods around 2000, and found that they were socially marginalized even as the state promoted them as cosmopolitan human capital. On work, Seo and Kubota (2022) analyzed 12 YouTube videos by three African American women teaching in EPIK and found that they described themselves as American teachers, targets of racial prejudice, and cultural ambassadors at the same time. The literature known to us includes no study of brokers, debt, or marriage migration among Americans in Korea.
Community Organizations
The American Chamber of Commerce in Korea (AMCHAM Korea), founded in 1953, is the largest foreign chamber of commerce in the country, with about 800 member companies and affiliates (AMCHAM Korea, n.d.). Yongsan International School of Seoul, founded in 1990 in Yongsan-gu, teaches an American-based K-12 curriculum with Advanced Placement courses and is accredited by WASC and ACSI (Network of International Christian Schools, n.d.).
None of the 1,720 migrant-serving organizations in the KIRD census names Americans in its name or target group (KIRD dataset). Americans can use the general-purpose organizations in the census, which serve residents of all nationalities.
Sources
Korea Immigration Regional Dashboard (KIRD) dataset. openICPSR. https://doi.org/10.3886/E249944V1
Embassy of the Republic of Korea in the USA (Ministry of Foreign Affairs). 2019. Overseas Korean (F-4) Visa. https://overseas.mofa.go.kr/us-en/brd/m_4502/view.do?seq=715891
Fragomen, Del Rey, Bernsen & Loewy LLP. 2023. South Korea: 'Visit Korea Year' Temporarily Exempts 22 Countries from K-ETA. https://www.fragomen.com/insights/south-korea-visit-korea-year-temporarily-exempts-22-countries-from-k-eta.html
KOWORK Visa Center (HRD Korea). n.d. E-2 Foreign Language Instructor. https://kowork.kr/en/visa/E-2
Seoulstart. 2026. EPS (eps.go.kr) in English: How Korea's Employment Permit System Works. https://seoulstart.com/guides/eps-korea-guide
The Korea Times. 2017. S. Korea scraps mandatory HIV test for native English teachers. https://www.koreatimes.co.kr/southkorea/society/20170708/s-korea-scraps-mandatory-hiv-test-for-native-english-teachers
Wagner, Benjamin K. 2021. International Human Rights Process Finally Achieves Equal Treatment for Foreign Teachers in Korea: The Case of L.G. v. Republic of Korea. Health and Human Rights Journal, Viewpoints, January 11. https://www.hhrjournal.org/2021/01/11/international-human-rights-process-finally-achieves-equal-treatment-for-foreign-teachers-in-korea-the-case-of-l-g-vs-republic-of-korea/
51st Force Support Squadron, Osan Air Base. n.d. Status of Forces Agreement (SOFA). https://51fss.com/status-of-forces-agreement-sofa/
The Korea Times. 2025. US think tank proposes slashing USFK troop level to about 10,000 from 28,500. https://www.koreatimes.co.kr/southkorea/defense/20250710/us-think-tank-proposes-slashing-usfk-troop-level-to-about-10000-from-28500
AMCHAM Korea. n.d. About Us. https://www.amchamkorea.org/aboutus/aboutus/
Network of International Christian Schools. n.d. Yongsan International School of Seoul. https://www.nics.org/schools/yongsan-international-school/
Seoulstart. 2025. Korea by the Numbers: Foreign Residents (숫자로 보는 한국: 2026년, 한국에는 누가 살고 있을까요?), citing Ministry of Justice, Immigration Statistics Monthly Report, December 2025. https://seoulstart.com/ko/guides/korea-by-the-numbers-foreign-residents
Greenback Tax Services. 2024. How Many Americans Live Abroad? The State Department's 9 Million Figure Is Quietly Going Away. https://www.greenbacktaxservices.com/blog/how-many-americans-live-abroad/
Overseas Koreans Agency, Republic of Korea. 2025. Overseas Koreans Population Statistics, Total (재외동포현황 총계). https://www.oka.go.kr/web/content.do?menu_cd=000101
Korea JoongAng Daily. 2026. E-2 Visa Applications for Native English Teachers Fall to Six-Year Low (원어민 영어교사 몰리던 한국 옛말... E-2 비자 신청자 6년 만에 최저). https://www.koreajoongangdaily.com/bilingual-news/woneomin-yeongeogyosa-mollideon-hangug-yesmal-e2-bija-sincheongja-6nyeon-mane-choejeo/12715725
Working Holiday Info Center, Ministry of Foreign Affairs, Republic of Korea. 2026. Country Information (U.S.A.). https://whic.mofa.go.kr/contents.do?menuNo=90&contentsNo=38
The Korea Times. 2025. House defense policy bill calls for maintaining 28,500 USFK troops. https://www.koreatimes.co.kr/amp/southkorea/defense/20250930/house-defense-policy-bill-calls-for-maintaining-28500-usfk-troops
Statistics of the World. 2025a. United States Personal Remittances Received (% of GDP), World Bank indicator BX.TRF.PWKR.DT.GD.ZS. https://statisticsoftheworld.com/country/united-states/BX.TRF.PWKR.DT.GD.ZS
Statistics of the World. 2025b. South Korea Personal Remittances Received (% of GDP), World Bank indicator BX.TRF.PWKR.DT.GD.ZS. https://statisticsoftheworld.com/country/south-korea/BX.TRF.PWKR.DT.GD.ZS
Kim, E. J. (2012). Human capital: Transnational Korean adoptees and the neoliberal logic of return. Journal of Korean Studies, 17(2), 299-327. https://doi.org/10.1353/jks.2012.0016
Seo, Y., & Kubota, R. (2022). Exploring lived experiences of Black female English teachers in South Korea: Understanding travelling intersectionality and subjectivities. Language, Culture and Curriculum, 36(1), 21-38. https://doi.org/10.1080/07908318.2022.2045303
Suh, S. C. (2019). Racing "return": The diasporic return of U.S.-raised Korean Americans in racial and ethnic perspective. Ethnic and Racial Studies, 43(6), 1072-1090. https://doi.org/10.1080/01419870.2019.1637531
Suggested citation: Korea Immigration Regional Dashboard (KIRD). 2026. “American Immigrants in South Korea.” Foreign Residents in South Korea series, September 2026. Data: Korea Immigration Regional Dashboard (KIRD) dataset, https://doi.org/10.3886/E249944V1. Interactive maps and tables: https://immigrantsinkorea.today.