 Korea Immigration Regional Dashboard
SpotlightSeptember 2026Nationality profilesDownload PDF
Japanese Immigrants in South Korea
Highlights
- In 2024, Japan was the fourteenth-largest nationality among registered foreigners in South Korea (28,005 people, 1.9 percent) and the tenth-largest among all resident foreigners (65,216 people, 2.5 percent), down from a peak of 86,196 resident foreigners in 2019.
- Short-term visitors on B-2 status made up 53.9 percent of Japanese residents in 2024, and Japanese nationals made up 38.0 percent of all Working Holiday (H-1) visa holders in the country.
- Women accounted for 69.5 percent of Japanese residents in 2024, compared with 45.1 percent of all resident foreigners.
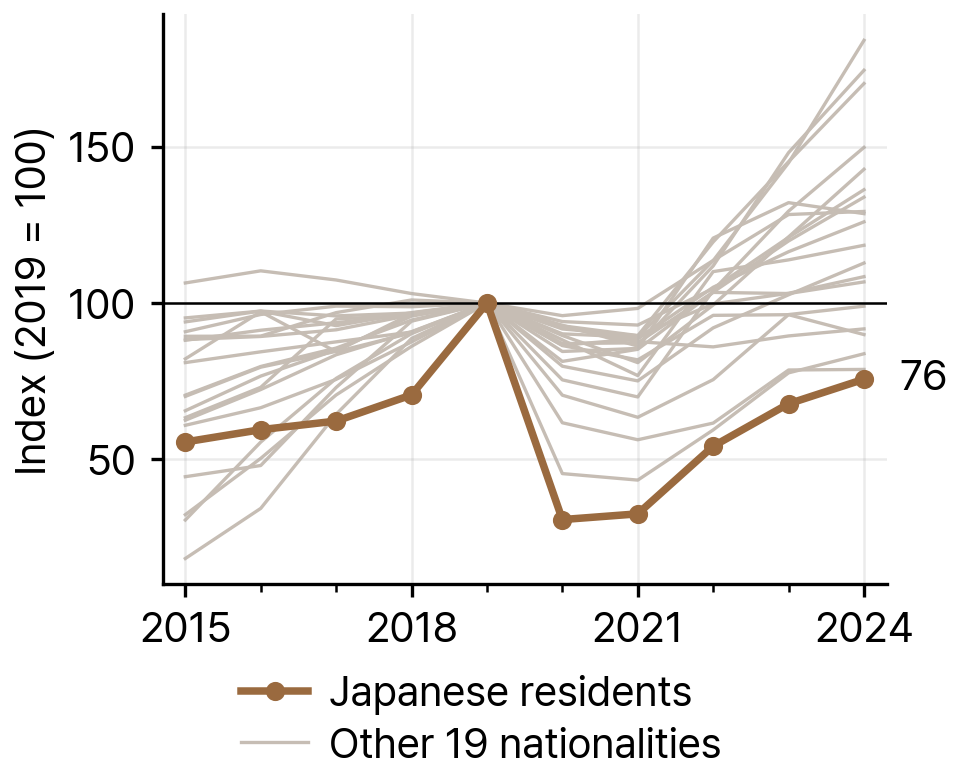
At the end of 2024, 28,005 Japanese nationals were registered foreigners in South Korea and 65,216 were resident foreigners. Japan was the fourteenth-largest nationality among registered foreigners (1.9 percent of the total) and the tenth-largest among all resident foreigners (2.5 percent). Among registered foreigners it ranked tenth in 2006, twelfth in 2014, and thirteenth in 2019; among all resident foreigners it ranked seventh in 2006 and 2014 and sixth in 2019. The resident count doubled from 43,207 in 2006 to a peak of 86,196 in 2019, fell to 26,515 in 2020, and by 2024 had recovered to 75.7 percent of its 2019 level. That index was the lowest among the 20 largest nationalities over 2019-24.
Japanese nationals come to Korea through several channels. Short visits under B-2 tourist and transit status make up the largest share, followed by marriage migration (F-6), permanent residence (F-5), study, corporate investment, and working holiday visas. Korea's Employment Permit System for lower-skilled workers has never included Japan among its sending countries (Korea Employment Information Service, 2024). Of the 65,216 resident Japanese in 2024, 28,005 (42.9 percent) were registered foreigners living in Korea for more than 90 days.
Compared with all resident foreigners in 2024, Japanese residents were more likely to be women (69.5 percent versus 45.1 percent), to be on short-term visit status (54.0 percent versus 19.7 percent), and to live in Seoul, Incheon, or Gyeonggi (66.1 percent versus 55.2 percent). Few had employment visas (7.7 percent versus 19.2 percent) or overseas Korean status (1.3 percent versus 24.5 percent). This Spotlight describes the size, location, age and sex, visa status, naturalization, and community institutions of Japanese residents in South Korea, and migration from Japan to Korea.
Size of the Population over Time
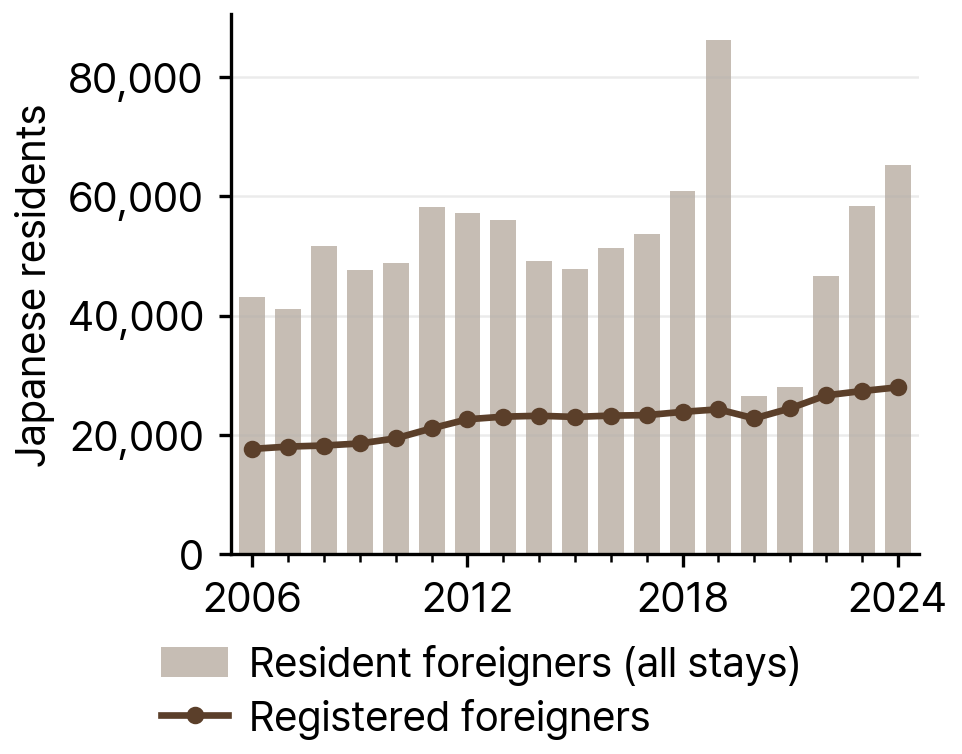
The number of Japanese resident foreigners in Korea rose slowly from 43,207 in 2006 to 49,152 in 2014, then climbed to 86,196 in 2019 (see Figure 1). In 2020 the count fell to 26,515, a drop of 59,681 people (69.2 percent) in one year. It rose to 46,741 in 2022, 58,438 in 2023, and 65,216 in 2024.
Registered foreigners changed much less. The registered Japanese population grew from 17,682 in 2006 to 23,237 in 2014, 24,316 in 2019, and 28,005 in 2024. Registered residents made up 28.2 percent of all resident Japanese in 2019 (24,316 of 86,196) and 42.9 percent in 2024. Most of the rise and fall in the total came from short-term visitors.
Source: KIRD dataset, from Ministry of Justice immigration yearbooks, 2006-2024.
Indexed to 2019, the Japanese population stood at 75.7 in 2024, the lowest value among the 20 largest nationalities in Korea (see Figure 2). Among all resident foreigners, Japan ranked seventh in 2014, sixth in 2019, and tenth in 2024. Among registered foreigners, a count that excludes short-term visitors, it ranked twelfth in 2014, thirteenth in 2019, and fourteenth in 2024.
Source: KIRD dataset, from Ministry of Justice immigration yearbooks, 2006-2024.
Table 1Japanese Residents in South Korea, Selected Years, 2006-24
| Year | Resident foreigners | Registered foreigners | Registered as share of resident (%) | Rank among resident foreigners | Rank among registered foreigners | Share of all resident foreigners (%) | Share of all registered foreigners (%) |
|---|---|---|---|---|---|---|---|
| 2006 | 43,207 | 17,682 | 40.9 | 7 | 10 | 4.7 | 2.8 |
| 2014 | 49,152 | 23,237 | 47.3 | 7 | 12 | 2.7 | 2.1 |
| 2019 | 86,196 | 24,316 | 28.2 | 6 | 13 | 3.4 | 1.9 |
| 2024 | 65,216 | 28,005 | 42.9 | 10 | 14 | 2.5 | 1.9 |
Note: Registered as share of resident is registered foreigners divided by resident foreigners. Resident foreigners include short-term visitors and overseas Koreans (F-4) who reported their residence; registered foreigners are long-term residents who registered with the Ministry of Justice.
Source: KIRD dataset, from Ministry of Justice immigration yearbooks, 2006-2024.
Distribution by Province and District
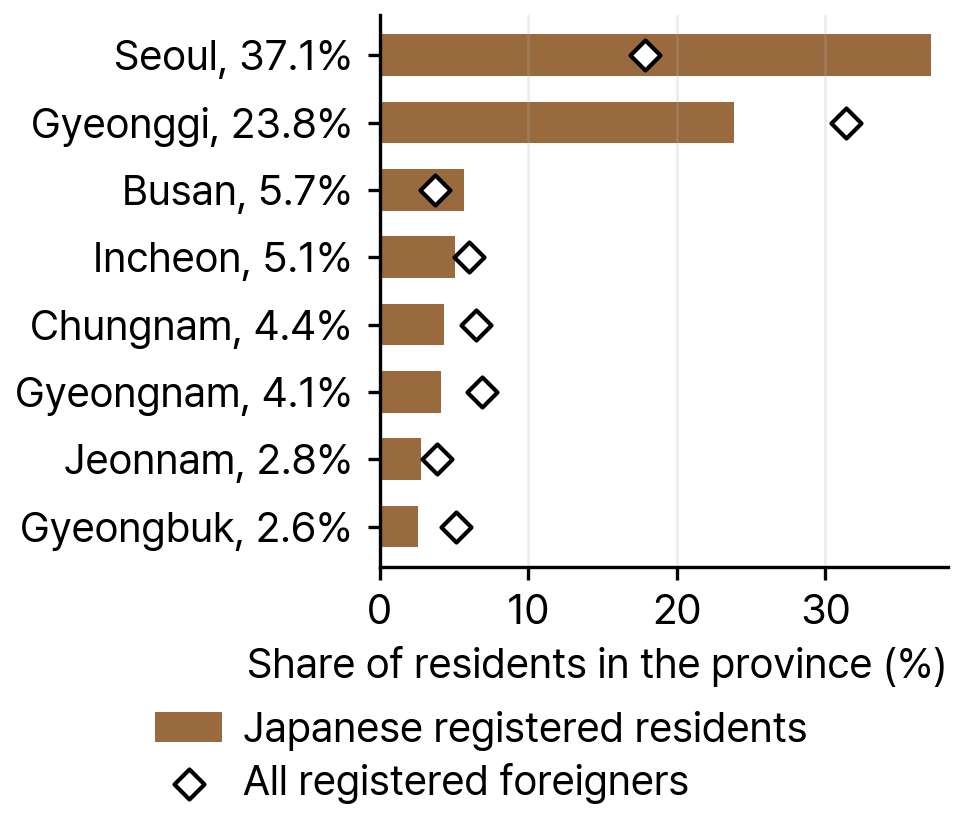
Location data cover the 28,005 Japanese registered foreigners in 2024. Seoul was home to 10,395 of them (37.1 percent), and Incheon and Gyeonggi to another 8,103 (28.9 percent). Yeongnam accounted for 15.9 percent, Chungcheong for 8.5 percent, Honam for 6.5 percent, and Gangwon and Jeju for 3.1 percent (see Figure 3). In total, 66.1 percent lived in the Seoul capital area, compared with 55.2 percent of all foreign residents.
Japanese residents were less likely than other foreign residents to live in rural counties (gun), at 7.6 percent compared with 10.6 percent of all foreign residents. The rural share was highest in Honam (34.0 percent) and in Gangwon and Jeju (25.4 percent).
Source: KIRD dataset, from Ministry of Justice registered-foreigner statistics by district, 2024.
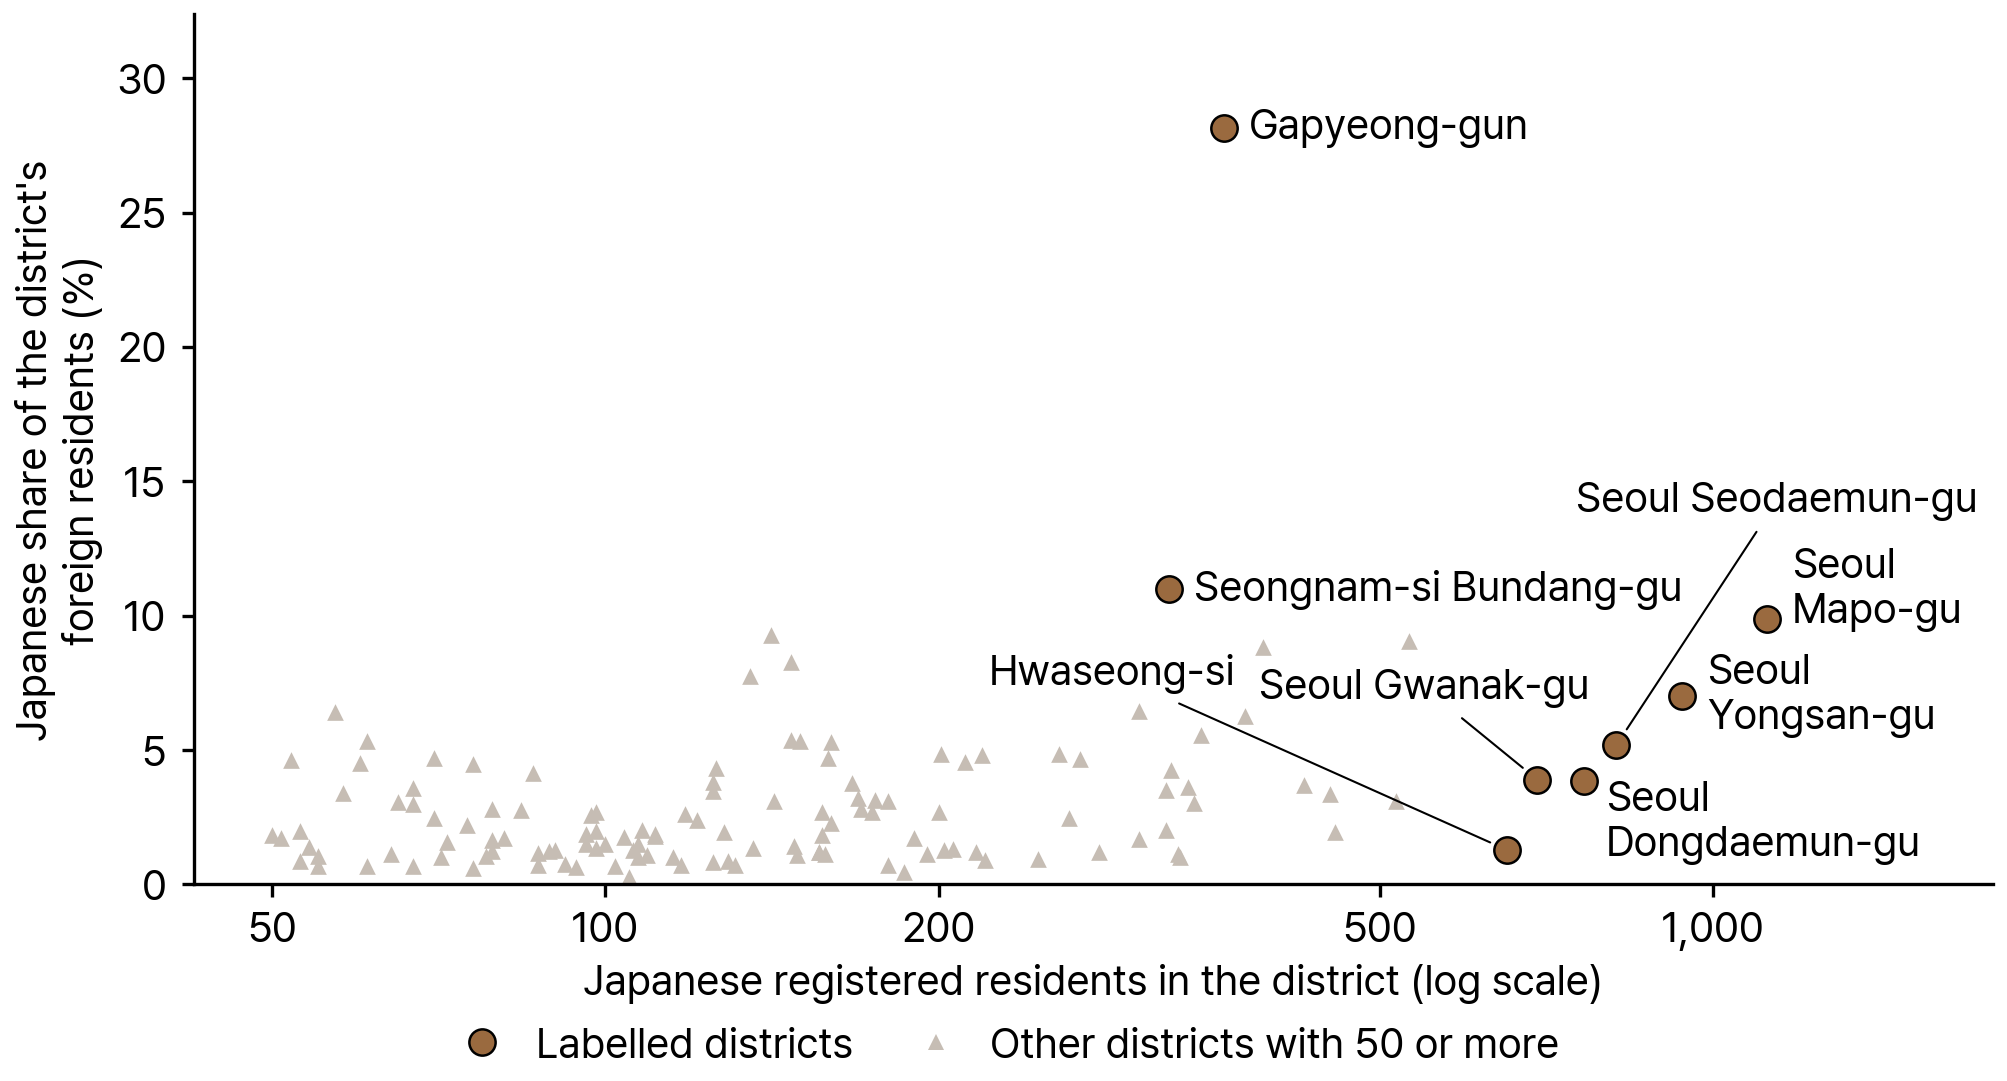
In 2024, 87 districts had at least 100 Japanese registered residents. The ten largest accounted for 24.8 percent of the group, and eight of them were in Seoul. Mapo-gu (1,118), Yongsan-gu (937), and Seodaemun-gu (818) had the most (see Figure 4). Outside Seoul, the largest communities were in Hwaseong-si (652) and Asan-si (456).
The group made up its highest share of local foreign residents in Gapyeong-gun in Gyeonggi, where 362 Japanese residents were 28.1 percent of the district's registered foreigners. Seongnam-si Bundang-gu (11.0 percent), Mapo-gu (9.9 percent), Guri-si (9.3 percent), and Gangnam-gu (9.1 percent) followed. No district met the enclave definition used in this series (a location quotient of at least 2 and at least 30 percent of the district's foreign residents) in 2024.
The dissimilarity index for Japanese residents fell from 0.288 in 2014 to 0.255 in 2024. About a quarter of the group would have had to change districts in 2024 to match the distribution of other foreign residents.
Source: KIRD dataset, from Ministry of Justice registered-foreigner statistics by district, 2024.
Table 2Ten Districts with the Most Japanese Registered Foreigners, 2024
| District | Province | Japanese residents | Share of district's foreign residents (%) |
|---|---|---|---|
| Mapo-gu | Seoul | 1,118 | 9.9 |
| Yongsan-gu | Seoul | 937 | 7.0 |
| Seodaemun-gu | Seoul | 818 | 5.2 |
| Dongdaemun-gu | Seoul | 765 | 3.9 |
| Gwanak-gu | Seoul | 694 | 3.9 |
| Hwaseong-si | Gyeonggi-do | 652 | 1.3 |
| Gangnam-gu | Seoul | 532 | 9.1 |
| Gwangjin-gu | Seoul | 517 | 3.1 |
| Asan-si | Chungcheongnam-do | 456 | 1.9 |
| Seongbuk-gu | Seoul | 451 | 3.3 |
Note: Counts are registered foreigners. The ten districts together accounted for 24.8 percent of Japanese registered foreigners in 2024.
Source: KIRD dataset, from Ministry of Justice registered-foreigner statistics by district, 2024.
Age and Sex
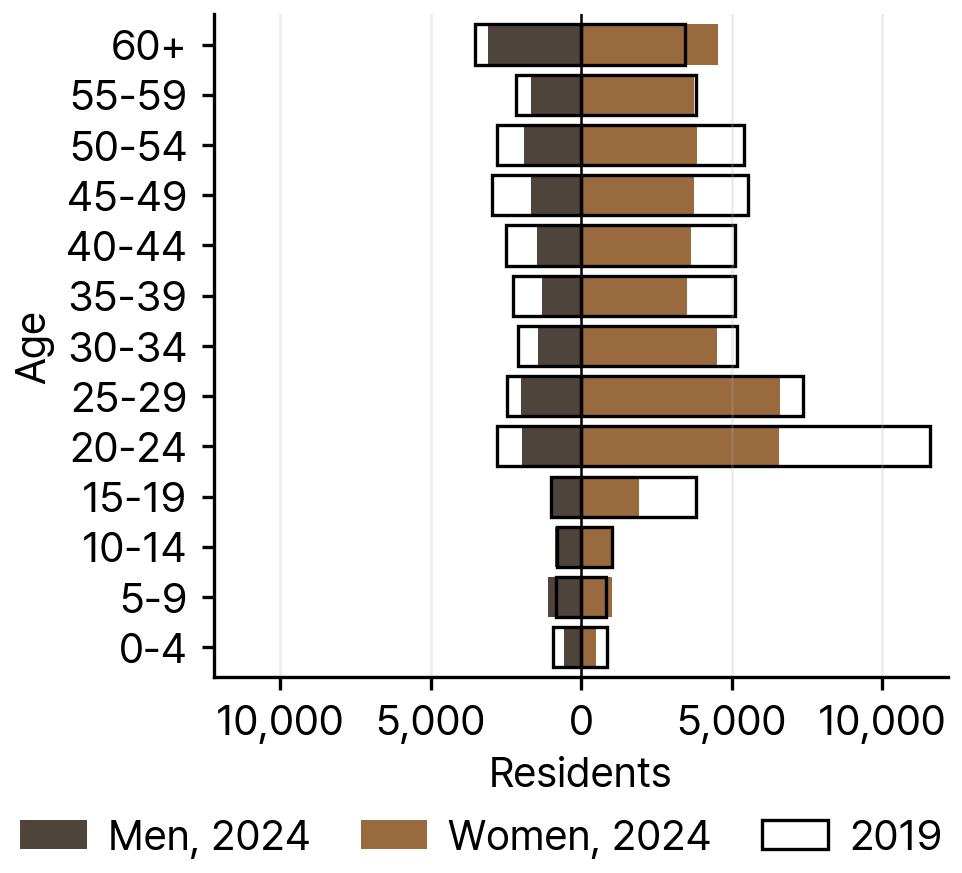
Women made up 69.5 percent of Japanese residents in 2024 (45,320 of 65,216), up from 68.6 percent in 2019. Among all resident foreigners, 45.1 percent were women (see Figure 5).
The largest five-year age group in 2024 was 25-29, and the median fell in the 35-39 group. Adults aged 20 to 39 made up 42.8 percent of Japanese residents, compared with 49.7 percent of all resident foreigners. Children under 15 were 7.8 percent (5,066 children), above the 5.7 percent share among all resident foreigners. People aged 60 and older were 11.7 percent, compared with 12.9 percent overall.
Between 2019 and 2024 the number of children under age 5 fell from 1,808 to 1,043. The population aged 50 and older fell less, from 21,143 to 18,831, and its share of the group rose from 24.5 percent to 28.9 percent.
Source: KIRD dataset, from Ministry of Justice immigration yearbooks, 2006-2024.
Visa Status
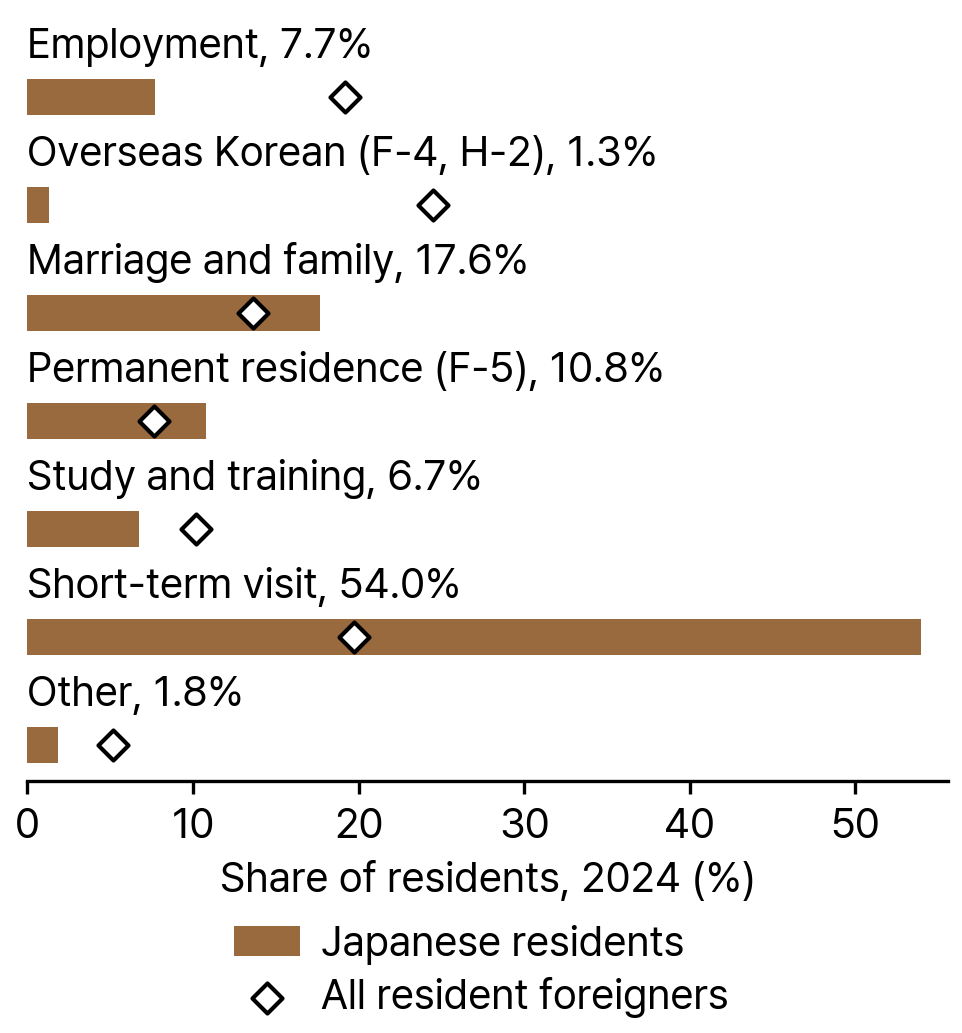
In 2024, 54.0 percent of Japanese residents were on a short-term visit status, nearly three times the share among all resident foreigners (19.7 percent). Marriage and family visas accounted for 17.6 percent (13.6 percent for all resident foreigners) and permanent residence for 10.8 percent (7.7 percent overall). Employment visas (7.7 percent), study and training visas (6.7 percent), and overseas Korean status (1.3 percent) were all less common than among resident foreigners as a whole (see Figure 6).
Source: KIRD dataset, from Ministry of Justice immigration yearbooks, 2006-2024.
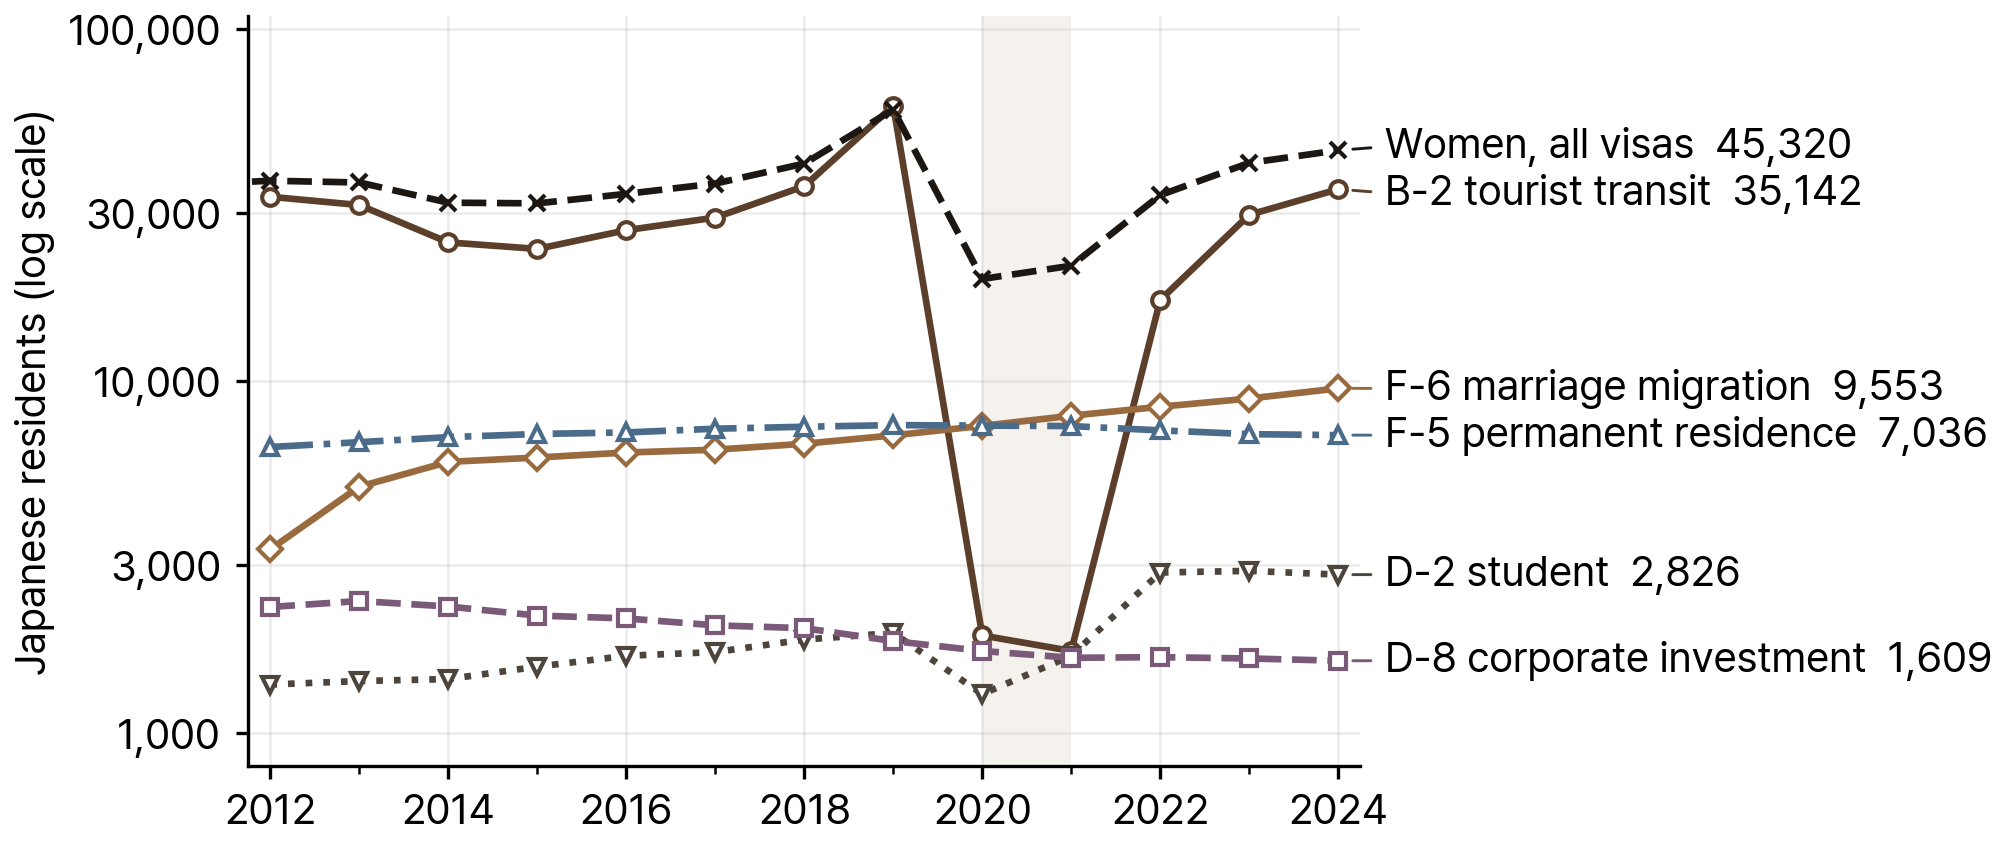
The number of B-2 visitors fell from 60,640 in 2019 to 35,142 in 2024, a decline of 25,498 that exceeds the group's overall decline of 20,980 (86,196 minus 65,216). Japanese nationals were 23.0 percent of all B-2 holders in Korea in 2024, the second-largest nationality on that status. Over the same period, holders of marriage migrant visas (F-6) rose from 7,026 to 9,553, students (D-2) from 1,929 to 2,826, and working holiday participants (H-1) from 1,076 to 1,445 (see Figure 7).
Japanese nationals accounted for a large share of two visa types. In 2024 they were 38.0 percent of all Working Holiday (H-1) visa holders and 19.2 percent of all Corporate Investment (D-8) visa holders in Korea.
Source: KIRD dataset, from Ministry of Justice immigration yearbooks, 2006-2024.
Table 3Main Visa Types Held by Japanese Residents in South Korea, 2019 and 2024
| Visa | Meaning | 2019 | 2024 | Share of Japanese residents, 2024 (%) | Japanese share of all holders in Korea, 2024 (%) |
|---|---|---|---|---|---|
| B-2 | Tourist and transit | 60,640 | 35,142 | 53.9 | 23.0 |
| F-6 | Marriage migration | 7,026 | 9,553 | 14.6 | 6.4 |
| F-5 | Permanent residence | 7,512 | 7,036 | 10.8 | 3.5 |
| D-2 | Student | 1,929 | 2,826 | 4.3 | 1.6 |
| D-8 | Corporate investment | 1,830 | 1,609 | 2.5 | 19.2 |
| D-4 | General trainee | 1,118 | 1,466 | 2.2 | 1.7 |
| H-1 | Working holiday | 1,076 | 1,445 | 2.2 | 38.0 |
Note: Shares of Japanese residents use the 2024 total of 65,216.
Source: KIRD dataset, from Ministry of Justice immigration yearbooks, 2006-2024.
Migration Channels and Policy
Japan is not a sending country under the Employment Permit System (E-9), which recruited lower-skilled workers from 17 countries as of 2024 (Korea Employment Information Service, 2024). Young Japanese adults can work in Korea under the reciprocal Working Holiday program, which Korea extended to Japan in April 1999 after Australia (1995) and Canada (1996). Participants must be 18 to 35 years old and may remain up to two years (Ministry of Foreign Affairs of Korea, 1999).
Marriage is the other main long-term channel. A 2014 count cited in a Korea Institute for Health and Social Affairs journal placed Japan third among the nationalities of marriage migrants in Korea, at 8.1 percent, after China (41.4 percent) and Vietnam (26.4 percent) (Kim et al., 2015). National marriage statistics for 2025 show 1,483 marriages between Korean men and Japanese women, up 26.1 percent from 1,176 in 2024, and 190 marriages between Korean women and Japanese men, up 29.3 percent from 147 (Korea.net, 2026).
At their August 23, 2025 summit, President Lee Jae-myung and Prime Minister Shigeru Ishiba agreed to raise the limit on Working Holiday participation from one time to two times (Ministry of Foreign Affairs of Korea, 2025).
Naturalization
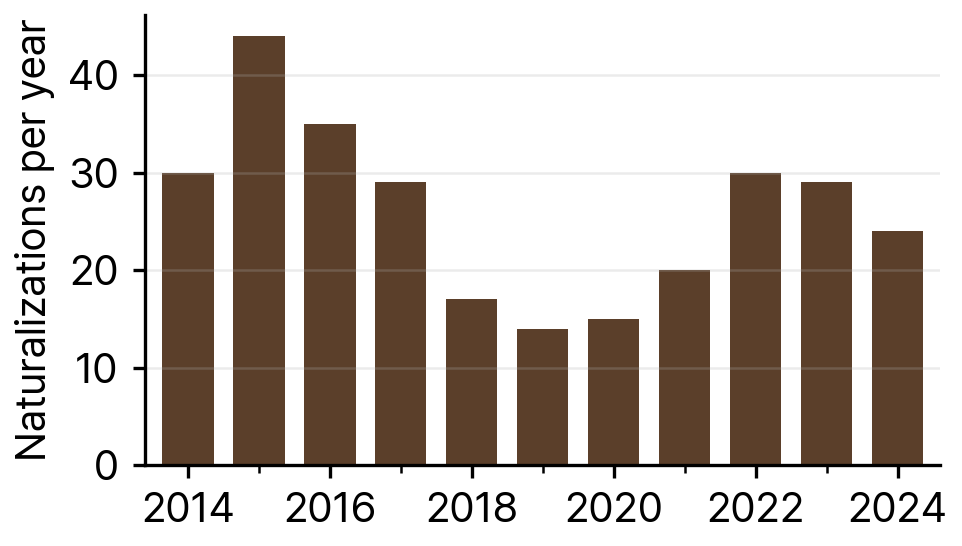
Between 2014 and 2024, 287 Japanese nationals naturalized as Korean citizens. Annual counts ranged from 14 in 2019 to 44 in 2015, with 24 in 2024 (see Figure 8).
Restoration of Korean nationality, which applies to people who once had Korean nationality, was more common than naturalization. Over 2011-24, 847 Japanese nationals restored Korean nationality, about 3.0 times the number who naturalized (847 divided by 287). There were 113 restorations in 2024.
Source: KIRD dataset, from Ministry of Justice immigration yearbooks, 2006-2024.
Unauthorized Residents
The Ministry of Justice yearbook (table 6-4) reports unauthorized residents separately only for the ten largest nationalities, and Japan is not among them, so no count for Japanese nationals is published. The yearbook reports 397,522 unauthorized residents of all nationalities in 2024.
Health and Well-being
To our knowledge, no published source reports clinical or survey health measures for Japanese nationals in Korea separately. Two qualitative studies focus on Japanese marriage migrant women.
An ethnographic study of 10 Japanese marriage migrant women in rural communities, with fieldwork from August 2017 to June 2018, grouped their adaptation into five cultural domains (practicing the doctrine, accepting the difference, redemption, true home, and confronting reality). The author described the central process as overcoming differences and conflicts between Korea and Japan to achieve a true family (An, 2018).
Semi-structured interviews with 13 Japanese marriage migrant women in South Korea found that their postmigration experiences and emotional responses were tied to media coverage, politics between the two countries, gender roles, parenting ideologies, and family relations (Takeda, 2023).
Migration from Japan to South Korea
Japan's Ministry of Foreign Affairs counted 1,293,097 Japanese nationals living abroad as of October 1, 2024. The United States (413,380, or 32.0 percent), Australia (104,141, or 8.1 percent), and China (97,538, or 7.5 percent) were the three largest destinations, and South Korea accounted for 3.3 percent (Ministry of Foreign Affairs of Japan, 2024a). The ministry's count for South Korea was 43,064 (Ministry of Foreign Affairs of Japan, 2024b). This figure comes from Japan's own survey of citizens abroad and uses a different definition from Korea's counts of 65,216 resident foreigners and 28,005 registered foreigners at the end of 2024. Secondary reports of the 2024 survey disagree on South Korea's exact rank among destinations, so this Spotlight reports no rank.
Japan is not a sending country under Korea's Employment Permit System, and migration from Japan to Korea takes place outside Korea's quota-based system for lower-skilled workers (Center for Global Development, 2024). There are therefore no figures on deployments of Japanese workers to Korea or on EPS applicants and places for Japan.
Personal remittances received by Japan equaled 0.11 percent of its GDP in 2024 (World Bank, 2024) and 0.11 percent in 2025 (TheGlobalEconomy.com, 2025). The available bilateral estimates describe money sent out of Japan. In the World Bank and KNOMAD estimates for 2021, South Korea was one of the five largest recipients of remittances from Japan, together with China, Vietnam, the Philippines, and Thailand (Statista, 2021). KNOMAD has not updated these bilateral estimates since then. The same estimates put remittances sent from South Korea to Japan at about US$145.7 million in 2021 (World Bank, 2021).
We know of no published breakdown of Korea-bound Japanese migrants by prefecture of origin in Japan. Sociologist Imasato Hajime reported in a 2026 interview that about two-thirds of Japanese residents in Korea live in the Seoul capital region (JBpress, 2026), close to the 66.1 percent of Japanese registered foreigners in Seoul, Incheon, and Gyeonggi in the KIRD data for 2024. Imasato also reported that men outnumbered women among Japanese residents until the 1980s, that the sex ratio reversed in 1993, and that the female share rose after the Korean Wave of the early 2000s to about 80 percent (JBpress, 2026). In the KIRD data, women were 69.5 percent of Japanese resident foreigners in 2024.
One group of women came through marriages arranged by the Unification Church. About 13,000 Japanese women moved to Korea through this channel from the 1990s, of whom about 6,000 later returned to Japan and about 7,000 remained in Korea, mostly in rural areas, as of 2023 (Asahi Shimbun, 2023).
The main bilateral mobility agreement is the Working Holiday program, which the 1998 Japan-South Korea Joint Declaration committed both governments to introduce from April 1999 (Ministry of Foreign Affairs of Japan, 1998). On the Japanese side, the government suspended visa-free entry for South Korean nationals and the validity of their existing visas from March 9, 2020, and resumed visa waivers for 68 countries and regions, including South Korea, on October 11, 2022, for visits of up to 90 days (Korea Herald, 2022).
Research on Japanese migrants in Korea has concentrated on marriage migrant women. A study of Japanese wives living permanently in Korea classified their marriage motives as economic necessity, romantic love, and religious affiliation, and found that motives shifted over time toward love-based partner choice (Kim, 2007). A survey of 106 Japanese marriage migrant women identified three common types of everyday microaggression and found that the women's emotional reactions varied with length of residence in Korea, closeness to the speaker, and national identity (Narita & Jang, 2020). Takeda observed that most research on Japanese-Korean marriages has studied Korean wives in Japan, with little on Japanese wives in Korea (Takeda, 2023). A book based on life-story interviews describes Japanese people who moved to Korea as lifestyle migrants, covers their motives, living conditions, and community, and treats this flow as distinct from labor or marriage migration (Imasato, 2025). Korean press coverage attributed the 40.2 percent rise in marriages between Korean men and Japanese women in 2024 to Korean Wave content and to perceptions of the income gap and marriage costs between the two countries (Seoul Economic Daily, 2026).
Table 4Migration indicators, Japan and South Korea
| Indicator | Value | Source |
|---|---|---|
| Japanese nationals living abroad, October 2024 | 1,293,097 | Ministry of Foreign Affairs of Japan, 2024a |
| Share of Japanese abroad living in South Korea, October 2024 (%) | 3.3 | Ministry of Foreign Affairs of Japan, 2024a |
| Japanese nationals in South Korea, Japan's count, October 2024 | 43,064 | Ministry of Foreign Affairs of Japan, 2024b |
| Japanese resident foreigners in South Korea, Korea's count, December 2024 | 65,216 | KIRD dataset |
| Employment Permit System sending country | No | Center for Global Development, 2024 |
| Personal remittances received by Japan, 2024 (% of GDP) | 0.11 | World Bank, 2024 |
| South Korea among the top five recipients of remittances from Japan, 2021 | Yes | Statista, 2021 |
| Japanese women who moved to Korea through Unification Church marriages since the 1990s | About 13,000 | Asahi Shimbun, 2023 |
Source: Sources listed in the table.
Community Organizations
The Japanese School in Seoul, founded on May 8, 1972, teaches the children of Japanese citizens living in Korea. It moved from Gaepo-dong, Gangnam-gu, to its current site in Sangam-dong, Mapo-gu, around 2010 (Korea International School Information Service; Consulate General of the Republic of Korea in Boston, 2008). Mapo-gu and Yongsan-gu were the two districts with the most Japanese registered foreigners in 2024.
Buyonghoe is a mutual aid association first formed by Japanese-born wives who remained in Korea after 1945. It began as Yayoi-kai, was renamed in 1965, and took its current name in 1966. It once had about 550 members in 9 branches; a small number of elderly members survive, some living at a nursing facility for Japanese wives in Gyeongju (Ryu, n.d.).
None of the 1,720 migrant-serving organizations in the KIRD census names Japanese residents in its name or target group. Most general-purpose organizations, such as multicultural family support centers, also serve Japanese residents.
Sources
Korea Immigration Regional Dashboard (KIRD) dataset. openICPSR. https://doi.org/10.3886/E249944V1
Korea Employment Information Service and Ministry of Employment and Labor. 2024. Significance and History of the Employment Permit System. https://www.eps.go.kr/eo/EmployPerSystem.eo?tabGb=01
Ministry of Foreign Affairs of the Republic of Korea. H-1 Working Holiday Visa program information. https://overseas.mofa.go.kr/ca-en/brd/m_5238/view.do?seq=659005
Kim, Yugyun, Inseo Son, and Seungseop Kim. 2015. Association between Discrimination Experience and Subjective Health among Marriage Migrants. Health and Social Welfare Review 35 (3): 421-452. https://www.kihasa.re.kr/hswr/assets/pdf/901/journal-35-3-421.pdf
Korea.net (Korean Culture and Information Service). 2026. Report on the National Data Agency's 2025 marriage and divorce statistics. https://www.korean-culture.org/koreanet/view.do?seq=1054044
Korea Herald. 2022. Visa Waivers to Japan Resume, with Expectations for Economic Recovery. https://www.koreaherald.com/article/2975435
Ministry of Foreign Affairs of the Republic of Korea. 2025. Korea-Japan Summit Joint Press Statement. https://www.mofa.go.kr/www/brd/m_28650/view.do?seq=12
An, Hyo Ja. 2018. Ethnography on the Adaptation Processes of Japanese Marriage Immigrant Women to Community in Rural Areas. Journal of Korean Academy of Psychiatric and Mental Health Nursing 27 (4): 394-405. https://www.jkpmhn.org/journal/view.php?doi=10.12934/jkpmhn.2018.27.4.394
Takeda, A. (2023). Intimate mobilities-International (transnational) marriage and migration: Japanese marriage migrants floating between Japan and Korea. Sociology Compass, 17(6), e13096. https://doi.org/10.1111/soc4.13096
Ministry of Foreign Affairs of Japan. 2024b. Republic of Korea: Basic Data. https://www.mofa.go.jp/mofaj/area/korea/data.html
World Bank. 2024. World Development Indicators: Personal Remittances, Received (% of GDP), Japan. https://api.worldbank.org/v2/country/JP/indicator/BX.TRF.PWKR.DT.GD.ZS?format=json&date=2018:2024&per_page=20
Korea International School Information Service. Japanese School in Seoul: school profile. http://www.isi.go.kr/schoolInfo/SinfoView.do?schoolType=ST01&schoolId=18
Consulate General of the Republic of Korea in Boston. 2008. International Schools Coming to Seoul. http://overseas.mofa.go.kr/us-boston-en/brd/m_4561/view.do?seq=616412
Ryu, Gyo-yeol (류교열). n.d. Buyonghoe (부용회). In Busan Grand Culture Encyclopedia (부산역사문화대전). Academy of Korean Studies. https://busan.grandculture.net/Contents/Contents?dataType=01&contents_id=GC04202994&isTreeSpread=Y&RequestBy=%ED%95%AD%EB%AA%A9%EB%A7%81%ED%81%AC&gcode=
Ministry of Foreign Affairs of Japan. 2024a. Annual Report of Statistics on Japanese Nationals Overseas, as of October 1, 2024. https://www.mofa.go.jp/mofaj/press/release/pressit_000001_01645.html
Center for Global Development. 2024. Employment Permit System (EPS). Global Skill Partnerships. https://gsp.cgdev.org/legalpathway/employment-permit-system-eps/
TheGlobalEconomy.com. 2025. Japan: Remittances, Percent of GDP (World Bank data). https://www.theglobaleconomy.com/Japan/remittances_percent_GDP/
Statista. 2022. Bilateral Remittances from Japan, 2021 (World Bank and KNOMAD data). https://www.statista.com/statistics/1382719/bilateral-remittances-japan
JBpress. 2026. Interview with sociologist Imasato Hajime on why Japanese people move to Korea. https://jbpress.ismedia.jp/articles/-/89291
Asahi Shimbun. 2023. Former Unification Church: Japanese Women Believers in Korea Today, a Phrase Found on a Local Flyer. https://www.asahi.com/articles/ASR24753DR1ZUTIL02T.html
Ministry of Foreign Affairs of Japan. 1998. Japan-Republic of Korea Joint Declaration: A New Japan-Republic of Korea Partnership towards the Twenty-first Century. https://www.mofa.go.jp/region/asia-paci/korea/joint9810.html
Seoul Economic Daily. 2026. Korean Men, Japanese Women Marriages Up 40 Percent to Decade High. https://en.sedaily.com/society/2026/03/18/korean-men-japanese-women-marriages-surge-40-percent-to
Kim, S.-R. (2007). 재한일본인 아내의 결혼동기에 관한 연구 [A study on the marriage motivation of Japanese wives residing in Korea]. Journal of the Japanese Language Education Association of Korea, 42, 241-258. https://www.kci.go.kr/kciportal/ci/sereArticleSearch/ciSereArtiView.kci?sereArticleSearchBean.artiId=ART001025717
Narita, M., & Jang, E.-Y. (2020). 한국에 거주하는 일본인 결혼이주여성의 마이크로어그레션 경험에 관한 연구 [A study of Japanese immigrant women's experiences of microaggressions in South Korea]. Multicultural Education Research, 13(4), 75-101. https://kiss.kstudy.com/Detail/Ar?key=3853574
Imasato, H. (2025). ライフスタイル移住の社会学: 日本から韓国への生活転換の実証研究 [The sociology of lifestyle migration: An empirical study of the life transition from Japan to Korea]. Akashi Shoten.
World Bank. 2021. Bilateral Remittance Estimates (WB_KNOMAD_BRE), Data360. https://data360api.worldbank.org/data360/data?DATABASE_ID=WB_KNOMAD&INDICATOR=WB_KNOMAD_BRE&REF_AREA=KOR
Suggested citation: Korea Immigration Regional Dashboard (KIRD). 2026. “Japanese Immigrants in South Korea.” Foreign Residents in South Korea series, September 2026. Data: Korea Immigration Regional Dashboard (KIRD) dataset, https://doi.org/10.3886/E249944V1. Interactive maps and tables: https://immigrantsinkorea.today.