 Korea Immigration Regional Dashboard
SpotlightSeptember 2026Nationality profilesDownload PDF
Sri Lankan Immigrants in South Korea
Highlights
- At the end of 2024, 33,965 Sri Lankan nationals were registered foreigners in South Korea, the 13th-largest nationality among registered foreigners and the 17th-largest among all resident foreigners (35,792 people, the highest count on record).
- The Sri Lankan population grew 42.8 percent between 2019 and 2024 (from 25,064 to 35,792), the fifth-fastest growth among the 20 largest nationalities.
- In 2024, 80.9 percent of Sri Lankan residents held employment visas and 9.7 percent were women, compared with 19.2 percent and 45.1 percent of all resident foreigners.
At the end of 2024, 33,965 Sri Lankan nationals were registered foreigners in South Korea, 2.3 percent of all registered foreigners and the 13th-largest nationality on that basis; counting short-term visitors, South Korea had 35,792 Sri Lankan resident foreigners on 31 December 2024, 1.4 percent of the total and the 17th-largest nationality. Among registered foreigners Sri Lanka ranked 12th in 2006, 11th in 2014, and 14th in 2019; among all resident foreigners it ranked 14th, 13th, and 19th in those years. The resident count stood at 12,594 in 2006 and 26,057 in 2014. Almost all Sri Lankan residents (94.9 percent in 2024) were registered foreigners, the category for foreign nationals in Korea for more than 90 days.
Most Sri Lankan nationals came as workers under the Employment Permit System (EPS), a program operated between the Korean government and the governments of sending countries that began in August 2004. By June 2012, 24,696 Sri Lankan workers were in Korea under the EPS, the fifth-largest group among 15 sending countries (ILO, 2012). The population fell from 25,064 in 2019 to 20,291 in 2021 and then rose to 35,792 in 2024. Over the same years, holders of specially designated activities (E-7) and dependent family (F-3) visas grew from a few hundred to several thousand.
Compared with all resident foreigners, Sri Lankan residents in 2024 were far more likely to hold employment visas, much more likely to be men, and more concentrated in ages 20 to 39. They lived mostly outside the Seoul capital area, with the largest share in the Yeongnam region of the southeast, and were more than twice as likely to live in rural counties. This Spotlight describes the size of the population, where Sri Lankan residents live, their age, sex, and visa status, the channels and policies behind their migration, naturalization, health and well-being, migration from Sri Lanka to South Korea, and community organizations.
Size of the Population over Time
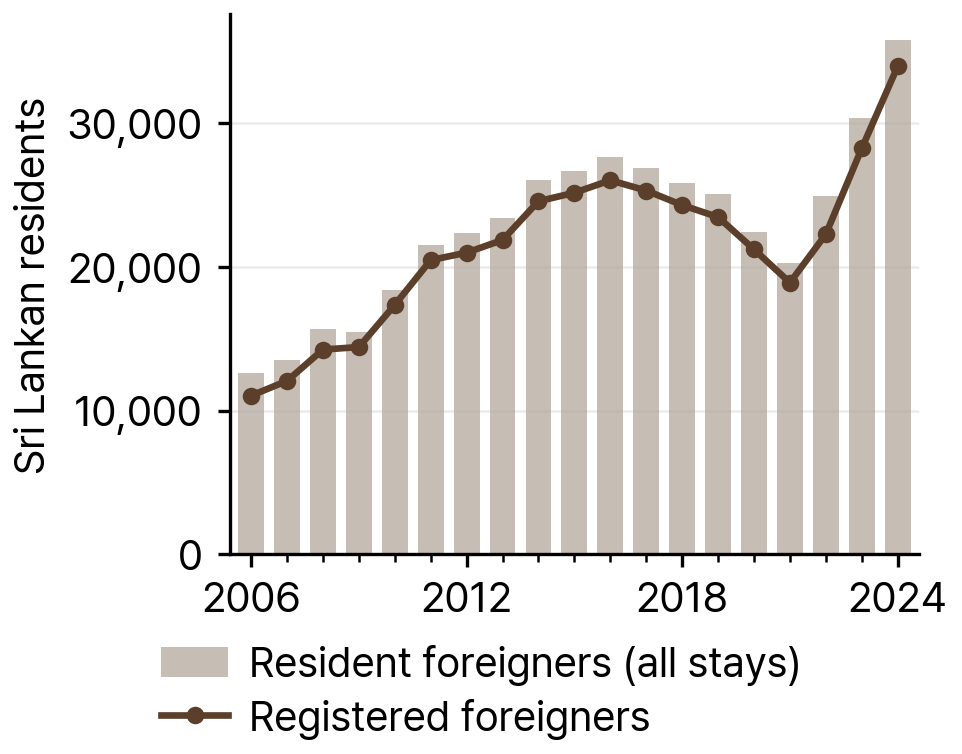
The number of Sri Lankan resident foreigners rose from 12,594 in 2006 to 18,377 in 2010 and 26,057 in 2014, then stood at 25,064 in 2019 (see Figure 1). It declined to 22,466 in 2020 and 20,291 in 2021, a drop of 19.0 percent from 2019 (4,773 fewer people). It then climbed to 24,912 in 2022, 30,370 in 2023, and 35,792 in 2024, the highest count on record. The 2024 total was about 2.8 times the 2006 total (35,792 against 12,594).
Registered foreigners made up most of the group in every year shown: 11,051 of 12,594 in 2006 and 33,965 of 35,792 in 2024 (94.9 percent). Sri Lankan nationals were 2.3 percent of all registered foreigners in 2024 and 1.4 percent of all resident foreigners, so the group ranks higher among registered foreigners (13th) than among all resident foreigners (17th) (see Table 1).
Source: KIRD dataset, from Ministry of Justice immigration yearbooks, 2006-2024.
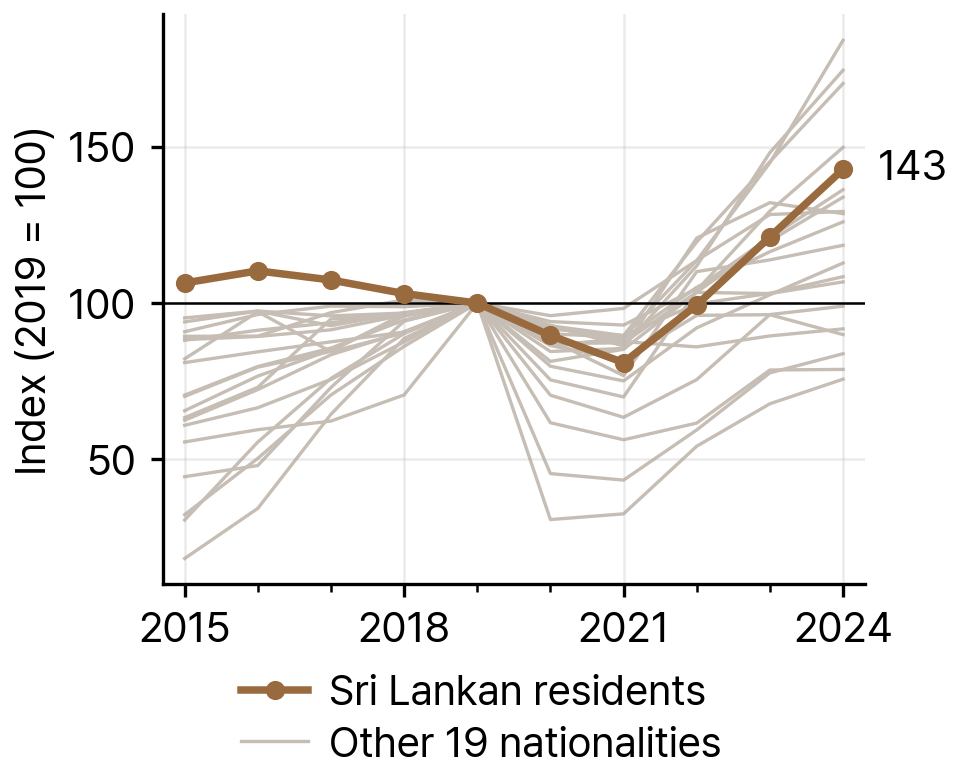
Indexed to 2019 = 100, the Sri Lankan population stood at 142.8 in 2024, a growth of 42.8 percent over five years. That was the fifth-fastest growth among the 20 largest nationalities in South Korea (see Figure 2). Because the population had fallen during 2020 and 2021, most of this growth came after 2021: the count rose by 15,501 between 2021 and 2024 (from 20,291 to 35,792).
Source: KIRD dataset, from Ministry of Justice immigration yearbooks, 2006-2024.
Table 1Sri Lankan Residents in South Korea, Selected Years, 2006-24
| Year | Resident foreigners | Registered foreigners | Registered as % of resident | Rank among registered foreigners | Rank among all resident foreigners | Share of all registered foreigners (%) | Share of all resident foreigners (%) |
|---|---|---|---|---|---|---|---|
| 2006 | 12,594 | 11,051 | 87.7 | 12 | 14 | 1.8 | 1.4 |
| 2014 | 26,057 | 24,582 | 94.3 | 11 | 13 | 2.3 | 1.4 |
| 2019 | 25,064 | 23,476 | 93.7 | 14 | 19 | 1.8 | 1.0 |
| 2024 | 35,792 | 33,965 | 94.9 | 13 | 17 | 2.3 | 1.4 |
Note: Registered as % of resident is computed as registered foreigners divided by resident foreigners. Resident foreigners include short-term visitors and F-4 residence reporters; registered foreigners are long-term residents who registered with immigration authorities.
Source: KIRD dataset, from Ministry of Justice immigration yearbooks, 2006-2024.
Distribution by Province and District
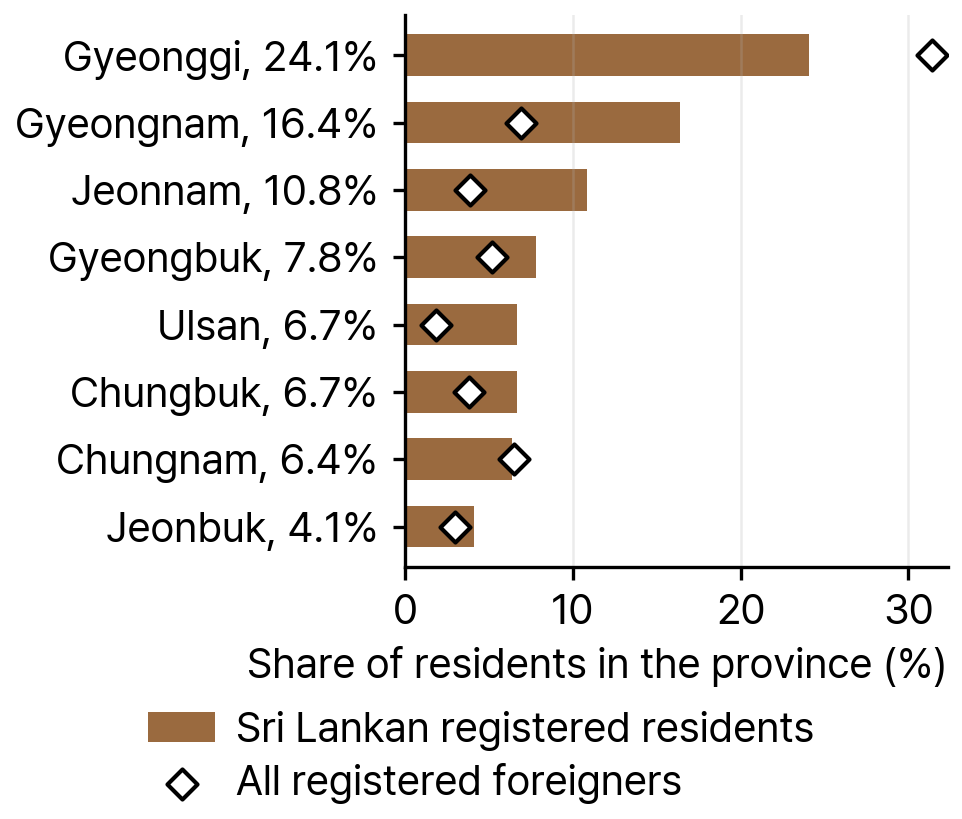
In 2024, 37.9 percent of Sri Lankan registered residents lived in the Yeongnam region (Busan, Daegu, Ulsan, and the Gyeongsang provinces), 27.1 percent in Incheon and Gyeonggi province, 16.5 percent in the Honam region, 14.0 percent in the Chungcheong region, 3.5 percent in Gangwon and Jeju, and 1.0 percent (351 people) in Seoul (see Figure 3). The Seoul capital area (Seoul, Incheon, and Gyeonggi) was home to 28.1 percent of the group, compared with 55.2 percent of all resident foreigners.
Sri Lankan residents were more likely than other foreigners to live in rural counties (gun): 26.0 percent did in 2024, against 10.6 percent of all resident foreigners. In the Honam region, 61.2 percent of Sri Lankan residents lived in rural counties, and in Chungcheong, 41.9 percent.
Source: KIRD dataset, from Ministry of Justice registered-foreigner statistics by district, 2024.
The largest Sri Lankan populations were in Hwaseong-si (1,670), Gimhae-si (1,617), Ulsan Dong-gu (1,366), and Geoje-si (1,079) (see Figure 4 and Table 2). The ten largest districts together accounted for 30.3 percent of Sri Lankan registered residents, and 80 districts had at least 100. In Seoul, the largest counts were in Yongsan-gu (60) and Gwanak-gu (47).
In some smaller districts, Sri Lankan nationals made up a large part of the foreign population. They accounted for 24.9 percent of registered foreigners in Daegu Gunwi-gun (145 people), 24.4 percent in Jindo-gun (638), 18.6 percent in Incheon Ongjin-gun (111), 16.3 percent in Wando-gun (832), and 14.2 percent in Ulsan Dong-gu (1,366).
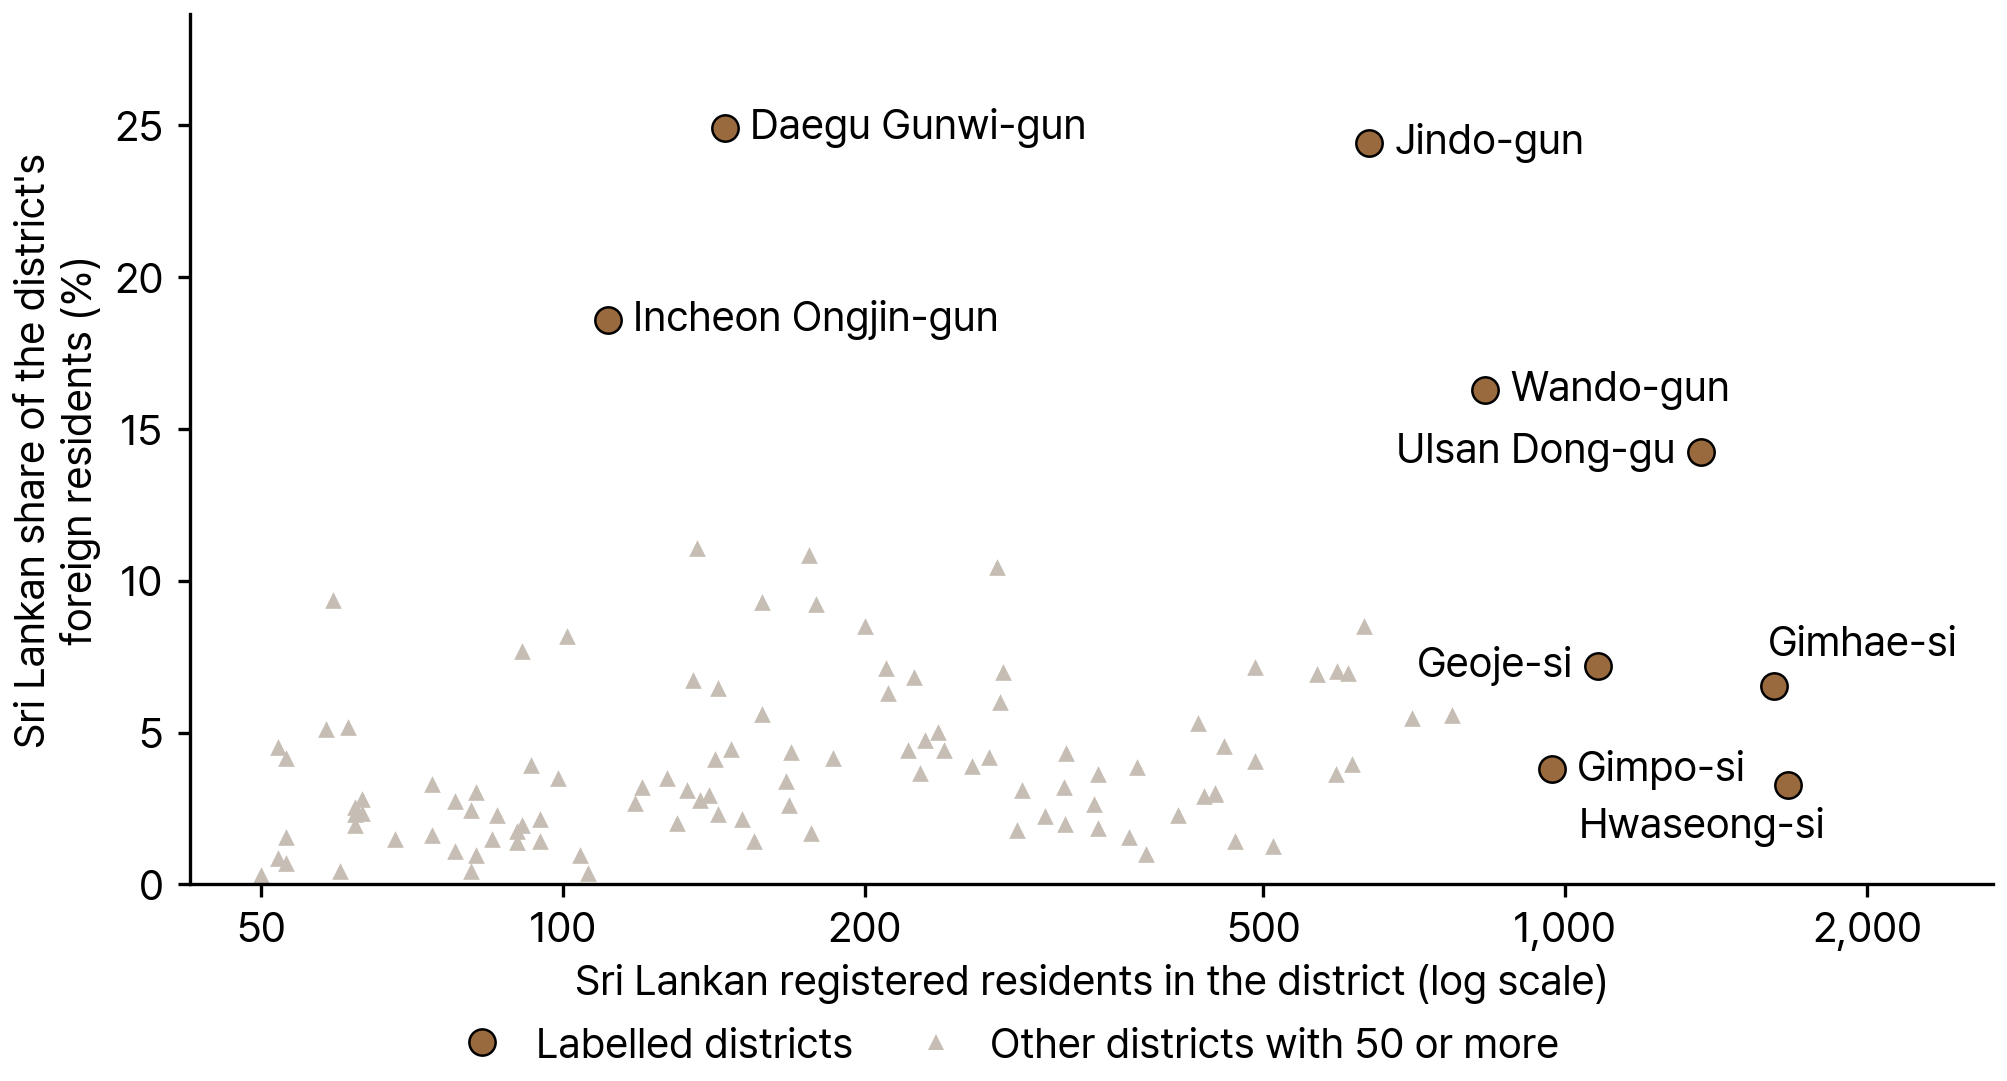
Source: KIRD dataset, from Ministry of Justice registered-foreigner statistics by district, 2024.
Table 2Ten Districts with the Most Sri Lankan Registered Residents, 2024
| District | Province | Sri Lankan residents | Share of district's foreign residents |
|---|---|---|---|
| Hwaseong-si | Gyeonggi-do | 1,670 | 3.3% |
| Gimhae-si | Gyeongsangnam-do | 1,617 | 6.5% |
| Ulsan Dong-gu | Ulsan | 1,366 | 14.2% |
| Geoje-si | Gyeongsangnam-do | 1,079 | 7.2% |
| Gimpo-si | Gyeonggi-do | 970 | 3.8% |
| Wando-gun | Jeollanam-do | 832 | 16.3% |
| Eumseong-gun | Chungcheongbuk-do | 772 | 5.6% |
| Gyeongju-si | Gyeongsangbuk-do | 703 | 5.5% |
| Jindo-gun | Jeollanam-do | 638 | 24.4% |
| Daegu Dalseong-gun | Daegu | 630 | 8.5% |
Note: Share of district's foreign residents is Sri Lankan registered residents divided by all registered foreigners in the district.
Source: KIRD dataset, from Ministry of Justice registered-foreigner statistics by district, 2024.
The index of dissimilarity (D), which measures how differently Sri Lankan residents and all other registered foreigners are spread across districts, fell from 0.571 in 2014 to 0.539 in 2024. A value of 0.539 means that about 54 percent of Sri Lankan residents would have to move to another district to match the distribution of other foreigners. No district met the KIRD definition of an ethnic enclave in 2024 (a location quotient of at least 2 and Sri Lankan nationals making up at least 30 percent of the district's foreign residents); the highest share, in Daegu Gunwi-gun, was 24.9 percent.
Age and Sex
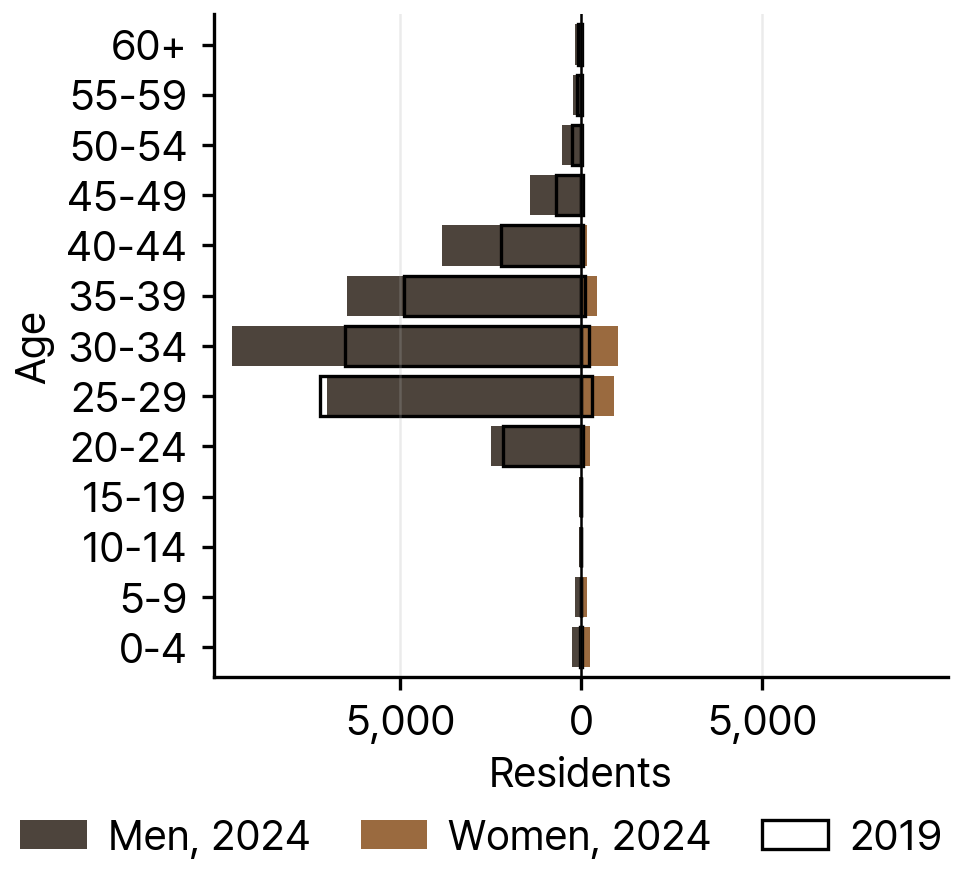
Sri Lankan residents were concentrated in young working ages. In 2024, 78.9 percent (28,228 people) were ages 20 to 39, compared with 49.7 percent of all resident foreigners. Both the largest five-year age group and the median fell in the group ages 30 to 34 (see Figure 5).
Children and older adults were few, though their numbers grew. Children under age 15 made up 2.6 percent of the group in 2024 (947 children, up from 118 in 2019), compared with 5.7 percent of all resident foreigners. Children under age 5 numbered 508 in 2024, up from 72 in 2019. People age 60 and older made up 0.6 percent, compared with 12.9 percent of all resident foreigners.
Women made up 9.7 percent of Sri Lankan residents in 2024 (3,487 women), up from 3.6 percent in 2019 (913 women). Among all resident foreigners, women made up 45.1 percent.
Source: KIRD dataset, from Ministry of Justice immigration yearbooks, 2006-2024.
Visa Status
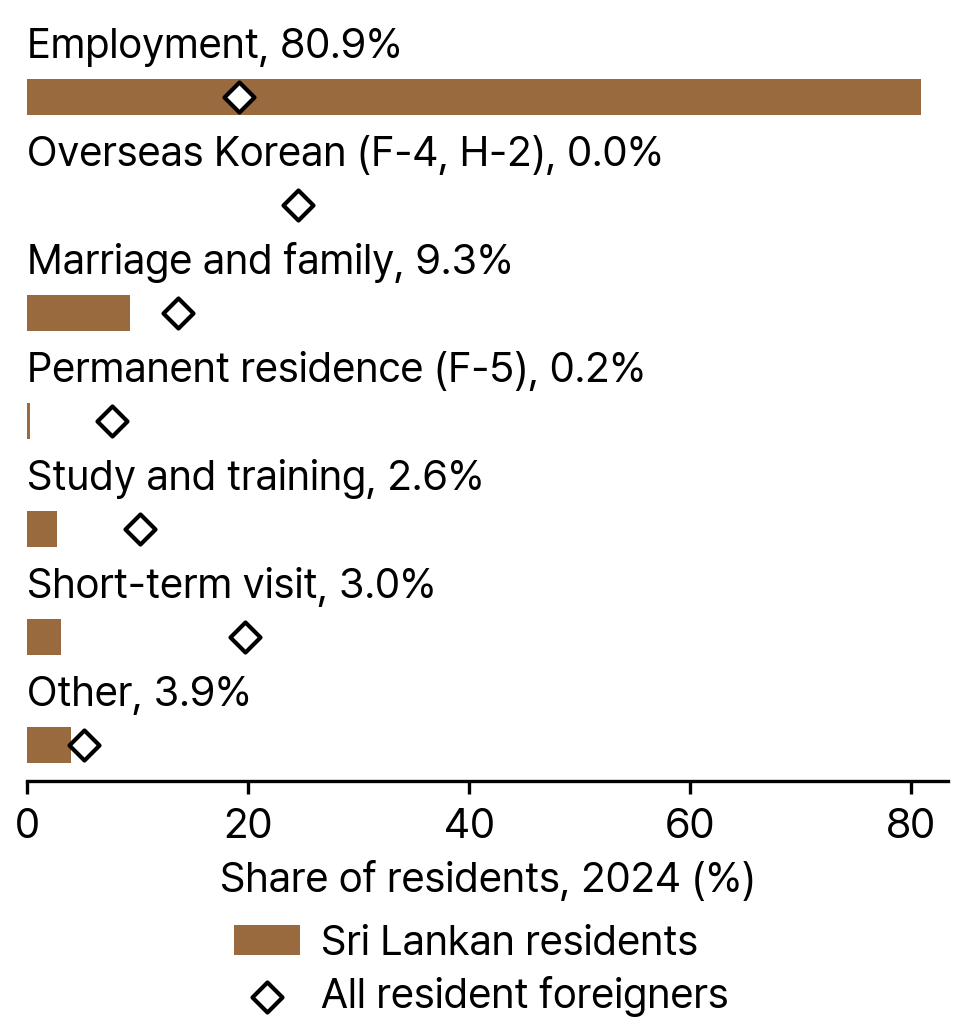
In 2024, 80.9 percent of Sri Lankan residents held an employment visa, compared with 19.2 percent of all resident foreigners (see Figure 6). Marriage and family visas accounted for 9.3 percent (13.6 percent for all resident foreigners), short-term visits for 3.0 percent (19.7 percent), study and training visas for 2.6 percent (10.2 percent), and permanent residence (F-5) for 0.2 percent (7.7 percent). Almost no Sri Lankan residents held overseas Korean visas (F-4 or H-2), which accounted for 24.5 percent of all resident foreigners.
Source: KIRD dataset, from Ministry of Justice immigration yearbooks, 2006-2024.
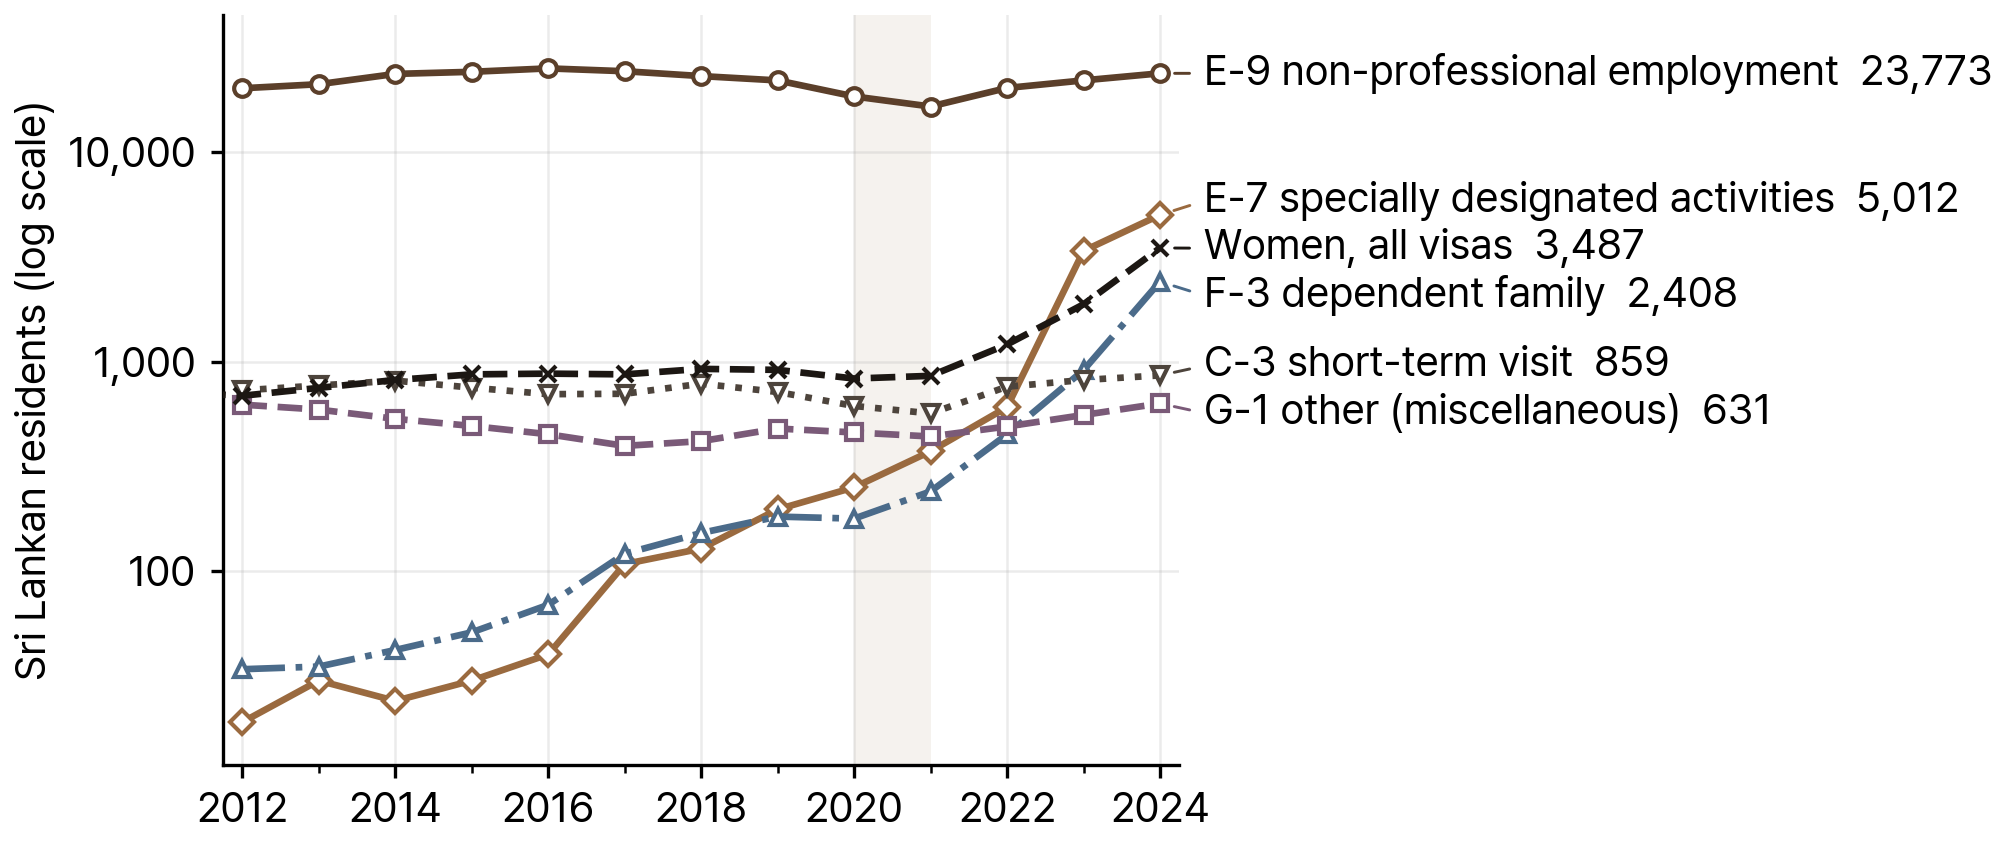
The E-9 non-professional employment visa, issued under the Employment Permit System, was held by 23,773 Sri Lankan residents in 2024, compared with 23,618 in 2014 and 21,992 in 2019. Sri Lankan nationals made up 7.0 percent of all E-9 holders in South Korea, the eighth-largest share of any nationality. The E-9 share of the group fell from about 88 percent in 2019 (21,992 of 25,064) to 66.4 percent in 2024.
Other visa types grew much faster after 2019 (see Figure 7). Specially designated activities (E-7) visa holders rose from 197 to 5,012 between 2019 and 2024, about 25 times, and Sri Lankan nationals made up 7.9 percent of all E-7 holders in South Korea in 2024. Dependent family (F-3) visa holders rose from 182 to 2,408, about 13 times. Student (D-2) visa holders rose from 288 to 612. Marriage migrant (F-6) visa holders changed less, from 308 to 373.
Source: KIRD dataset, from Ministry of Justice immigration yearbooks, 2006-2024.
Table 3Sri Lankan Residents by Visa Type, 2019 and 2024
| Visa | Meaning | 2019 | 2024 | Share of Sri Lankan residents, 2024 | Sri Lankan share of all holders of this visa, 2024 |
|---|---|---|---|---|---|
| E-9 | Non-professional employment | 21,992 | 23,773 | 66.4% | 7.0% |
| E-7 | Specially designated activities | 197 | 5,012 | 14.0% | 7.9% |
| F-3 | Dependent family | 182 | 2,408 | 6.7% | 4.6% |
| C-3 | Short-term visit | 716 | 859 | 2.4% | 0.5% |
| G-1 | Other (miscellaneous) | 479 | 631 | 1.8% | 1.1% |
| D-2 | Student | 288 | 612 | 1.7% | 0.3% |
| F-6 | Marriage migration | 308 | 373 | 1.0% | 0.3% |
Note: Shares of Sri Lankan residents are out of 35,792 resident foreigners of Sri Lankan nationality in 2024.
Source: KIRD dataset, from Ministry of Justice immigration yearbooks, 2006-2024.
Migration Channels and Policy
Sri Lanka sends workers to Korea under the Employment Permit System, which South Korea implemented in August 2004 and operates through agreements with the governments of sending countries. As of June 2012, 24,696 Sri Lankan workers were in Korea under the EPS, the fifth-largest group among the 15 countries with an EPS memorandum of understanding at the time (ILO, 2012).
A 2018 study of Sri Lankan workers who returned from South Korea listed the reasons Korea became one of the top destinations for Sri Lankan labor migrants: low pre-departure costs, no fees to recruitment agencies, no specific educational qualifications or professional tests beyond basic Korean language, relatively high salaries, and a legal work visa granted for five years. Under this route, 7,406 Sri Lankan workers entered Korea in 2011, 5,630 in 2012, and 5,389 in 2013 (Karunaratne and Abeygunawardana 2018).
Naturalization
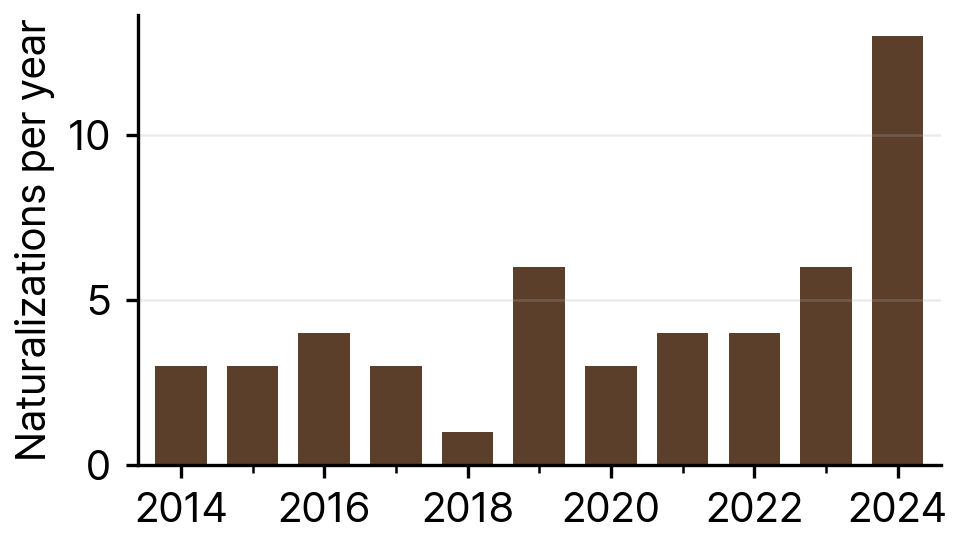
Between 2014 and 2024, 50 Sri Lankan nationals naturalized as South Korean citizens. Annual counts ranged from 1 to 6 between 2014 and 2023, with the low of 1 in 2018, and rose to 13 in 2024 (see Figure 8). The 13 naturalizations in 2024 equal about 0.04 percent of the 35,792 Sri Lankan residents that year.
Source: KIRD dataset, from Ministry of Justice immigration yearbooks, 2006-2024.
Unauthorized Residents
Sri Lanka is not among the ten nationalities that the Ministry of Justice immigration yearbook (table 6-4) reports separately for unauthorized residents, so no count of unauthorized Sri Lankan residents is published. The yearbook reported 397,522 unauthorized residents of all nationalities in 2024.
Health and Well-being
A study of 67,576 migrant workers with recorded occupational injuries in South Korea between January 2007 and September 2018 included 2,584 Sri Lankan nationals, of whom 22 died from their injuries (about 0.9 percent) (Lee et al. 2023).
A 2021 survey of Sri Lankan EPS workers in Korean manufacturing found that unfamiliar work practices and a lack of safety and work training were an impediment, and that language was one of the main barriers to living and working in Korea (Don and Hong 2021).
In February 2025, a Korean forklift operator at a brick factory in Naju tied a 31-year-old Sri Lankan worker in plastic wrap and lifted him with a forklift. South Korea's Labor Ministry rejected the factory head's description of the incident as a prank and investigated whether workers had experienced beating, bullying, and overdue wages. In May 2026, the operator received a suspended prison sentence and community service, and the company was fined 5 million won (Business & Human Rights Resource Centre, 2025).
Migration from Sri Lanka to South Korea
South Korea receives a small share of Sri Lankan labor migrants. In 2023, 9,746 of the 297,656 Sri Lankans who registered with the Sri Lanka Bureau of Foreign Employment (SLBFE) registered for jobs in South Korea, about 3.3 percent, making Korea the seventh-largest destination after Saudi Arabia, Kuwait, Qatar, the United Arab Emirates, the Maldives, and Romania (SLBFE 2023). In 2024 the number fell to 7,114 of 314,786, about 2.3 percent, and Korea dropped to tenth place, behind Kuwait, the United Arab Emirates, Saudi Arabia, Qatar, the Maldives, Romania, Israel, Japan, and Oman (SLBFE 2025a). UN DESA estimated that 16,851 Sri Lanka-born people lived in South Korea in mid-2024, about 1.1 percent of the 1,492,103 Sri Lankan emigrants worldwide, which placed Korea 15th among destination countries (UN DESA 2024). That estimate is lower than the 35,792 Sri Lankan resident foreigners counted by the Ministry of Justice at the end of 2024.
Sri Lanka's Labour Ministry said it sent 6,500 to 7,000 workers to South Korea in 2023 and planned to send 10,000 in 2024, mainly in production, fishing, and construction (EconomyNext 2024). In the first half of 2025, 3,134 of the 144,379 Sri Lankans who left for foreign employment went to South Korea, about 2.2 percent (SLBFE 2025b). For the EPS-TOPIK round with applications taken from 15 to 17 September 2025, Korea's Ministry of Employment and Labor and HRD Korea set a recruitment quota of 2,500 Sri Lankan workers, 2,000 in manufacturing and 500 in fisheries (MOEL and HRD Korea 2025). Over all of 2024, 58,369 Sri Lankans took the EPS-TOPIK and 9,530 passed (HRD Korea 2025); Korea admitted 5,562 Sri Lankan workers on E-9 visas that year and 3,730 in 2025 (Ministry of Employment and Labor 2026).
World Bank data put personal remittances received by Sri Lanka at 7.16 percent of GDP in 2023 and 6.75 percent in 2024 (World Bank 2024). In the third quarter of 2025, Sri Lanka received US$111.8 million in workers' remittances from South Korea, the eighth-largest amount from a single country, after the United Arab Emirates, Kuwait, the United Kingdom, Saudi Arabia, Qatar, Italy, and the United States (Central Bank of Sri Lanka 2025).
We know of no published breakdown of Korea-bound migrants by district, province, or language group. For the population as a whole, Sinhala and Tamil are the official languages.
In February 2025, Sri Lanka's Cabinet approved a memorandum of understanding with South Korean provincial and municipal councils for seasonal work under Korea's E-8 visa. Workers may serve up to three terms within a maximum of three years, and no private Sri Lankan agency is authorized to send workers under this route. The Cabinet spokesman warned that overstaying visas would lead to reduced quotas for Sri Lankan workers and could cost access to both E-8 and E-9 visas (Daily FT 2025). Under the 2025 point-based selection system for Sri Lankan EPS applicants, candidates must be aged 18 to 39, have no criminal record or history of forced deportation from Korea, pass a color-vision screening, and not have already spent five years or more in Korea on an E-9 or E-10 visa. Applicants who meet these conditions are narrowed to 1.1 times the recruitment quota before a second-round skills test and job-capacity assessment (MOEL and HRD Korea 2025).
Research on Sri Lankan migration to Korea is limited. Shaw (2010), using household survey data, finds that Sri Lankan labor migration diversified away from the Middle East from the late 1990s, with Korea among the new destinations in Asia and Europe, and that nearly half of the migrant workforce became male. Karunaratne and Abeygunawardana (2018), studying workers who returned from Korea, report that 60 percent of returnees were engaged in business ventures and 32 percent had put their savings mainly into land or housing. Don and Hong (2021) find that Sri Lankan EPS workers in Korean manufacturing lacked safety and job training and faced language barriers at work. We are not aware of any study of brokers, migration debt, or marriage migration specific to Sri Lankans in Korea.
Table 4Migration indicators, Sri Lanka and South Korea
| Indicator | Value | Source |
|---|---|---|
| Sri Lanka-born population in South Korea, mid-2024 | 16,851 | UN DESA 2024 |
| South Korea's share of Sri Lankan emigrants and rank among destinations, 2024 | About 1.1 percent (16,851 of 1,492,103); 15th | UN DESA 2024 |
| SLBFE registrations for jobs in South Korea, 2023 | 9,746 of 297,656 (3.3 percent); seventh | SLBFE 2023 |
| SLBFE registrations for jobs in South Korea, 2024 | 7,114 of 314,786 (2.3 percent); tenth | SLBFE 2025a |
| Workers sent to South Korea, 2023 (Labour Ministry) | 6,500 to 7,000; 10,000 planned for 2024 | EconomyNext 2024 |
| Departures for employment in South Korea, January-June 2025 | 3,134 of 144,379 (2.2 percent) | SLBFE 2025b |
| EPS recruitment quota for Sri Lanka, September 2025 round | 2,500 (2,000 manufacturing, 500 fisheries) | MOEL and HRD Korea 2025 |
| EPS-TOPIK test takers in Sri Lanka, 2024 | 58,369 (9,530 passed) | HRD Korea 2025 |
| E-9 workers admitted from Sri Lanka, 2024 and 2025 | 5,562 and 3,730 | Ministry of Employment and Labor 2026 |
| Workers' remittances from South Korea, third quarter of 2025 | US$111.8 million; eighth among source countries | Central Bank of Sri Lanka 2025 |
| Personal remittances as share of GDP | 7.16 percent (2023); 6.75 percent (2024) | World Bank 2024 |
Note: As far as we know, no breakdown of Korea-bound migrants by district or language group has been published.
Community Organizations
Buddhist ties connect the two countries. Kandy and Gyeongju established a sister-city partnership in 2018, many Sri Lankan Buddhist monks live in Korea and practice Korean Buddhism, and in August 2021 Gyeongju City provided financial assistance and medical units to the National Hospital of Kandy for COVID-19 patients (Korea Times, 2023). Sri Lankan students have their own association, the Sri Lankan Students Association - Korea (SLSA-Korea), based in Seoul (SLSA-Korea, 2026).
Of the 1,720 migrant-serving organizations in the KIRD census, 4 name Sri Lankan people or Sri Lanka in their name or target group, and all 4 are religious sites. They are Love Sri Lanka Church (Sangnok-gu, Ansan), the Asan Sri Lanka Maha Vihara temple (Dhamma Friends, Asan-si), the Mahamevnawa meditation center (Danwon-gu, Ansan), and Sri Radha Shyamasundar Mandir, the ISKCON Seoul temple (Yongsan-gu, Seoul). Most general-purpose organizations in the census, such as multicultural family and foreign worker support centers, also serve Sri Lankan residents.
Sources
KIRD dataset (Korea Immigration Regional Dashboard), openICPSR. https://doi.org/10.3886/E249944V1
International Labour Organization. 2012. Introduction to EPS (Employment Permit System overview presentation). https://www.ilo.org/media/273826/download
Karunaratne, H. D., & Abeygunawardana, K. (2018). Reintegration of Sri Lankan returnee migrant workers from South Korea. *Keizai Shirin (The Hosei University Economic Review), 85*(3), 65-94. https://doi.org/10.15002/00014804
Daily FT. 2025. Sri Lanka, South Korea to Ink MoU on Seasonal Workers Program. https://www.ft.lk/business/Sri-Lanka--South-Korea-to-ink-MoU-on-seasonal-workers-program/34-773309
Lee, J.-Y., Lee, W., & Cho, S. (2023). Characteristics of fatal occupational injuries in migrant workers in South Korea: A machine learning study. *Heliyon, 9*(9), e20138. https://doi.org/10.1016/j.heliyon.2023.e20138
Don, R. K. M. A., & Hong, S.-C. (2021). Sri Lankan migrant worker perceptions of workplace hazard and safety awareness: Case of the manufacturing industry in Korea. *International Journal of Occupational Safety and Ergonomics, 28*(4). https://doi.org/10.1080/10803548.2021.1992158
Business & Human Rights Resource Centre. 2025. S. Korea: Sri Lankan Worker Tied to Forklift as "Punishment" at a Brick Factory in Naju. https://www.business-humanrights.org/en/latest-news/s-korea-sri-lankan-worker-tied-to-forklift-as-punishment-at-a-brick-factory-allegedly-suffering-from-trauma-authorities-launch-investigation-incl-co-comments/
Central Bank of Sri Lanka. 2025. Quarterly Bulletin of Workers' Remittances and Labour Migration, Quarter 3, 2025. https://www.cbsl.gov.lk/sites/default/files/cbslweb_documents/statistics/workers_remittances_and_labour_migration_bulletin_2025_q3_e.pdf
Choe Chong-dae. 2023. Buddhist Ties between Korea and Sri Lanka. The Korea Times. https://www.koreatimes.co.kr/pages/article.asp?newsIdx=344773
Sri Lankan Students Association - Korea (SLSA-Korea). Facebook page. https://www.facebook.com/slsakorea/
Sri Lanka Bureau of Foreign Employment. 2023. Annual Statistics of Foreign Employment 2023. https://www.slbfe.lk/wp-content/uploads/2024/10/sodapdf-converted-18_compressed.pdf
Sri Lanka Bureau of Foreign Employment. 2025. Annual Statistical Report of Foreign Employment 2024. https://www.slbfe.lk/wp-content/uploads/2025/11/for-web-slbfe_251127_143733_compressed-1.pdf
Sri Lanka Bureau of Foreign Employment. 2025. 144,000 Sri Lankans Leave for Foreign Employment in First Half of 2025. https://www.slbfe.lk/slbfe-news/144000-sri-lankans-leave-for-foreign-employment-in-first-half-of-2025/
United Nations Department of Economic and Social Affairs, Population Division. 2024. International Migrant Stock 2024: Destination and Origin. https://www.un.org/development/desa/pd/content/international-migrant-stock
EconomyNext. 2024. Sri Lanka to Send 10,000 Workers to South Korea: Labor Ministry. https://economynext.com/sri-lanka-to-send-10000-workers-to-south-korea-labor-ministry-166433/
Ministry of Employment and Labor and Human Resources Development Service of Korea, with the Sri Lanka Bureau of Foreign Employment. 2025. Notice on the Implementation of the Point-Based Selection System for Foreign Workers. https://www.slbfe.lk/wp-content/uploads/2025/08/Notice-on-admission-issuing-English5.pdf
World Bank, World Development Indicators. Personal Remittances, Received (% of GDP), Sri Lanka, 2023-2024. https://data.worldbank.org/indicator/BX.TRF.PWKR.DT.GD.ZS?locations=LK
Shaw, J. (2010). From Kuwait to Korea: The diversification of Sri Lankan labour migration. *Journal of the Asia Pacific Economy, 15*(1), 59-70. https://doi.org/10.1080/13547860903488237
Human Resources Development Service of Korea (HRD Korea). 2025. 국가별 한국어시험 시행 정보 [EPS-TOPIK test takers and passes by country, 2024]. Archived April 21, 2025. https://web.archive.org/web/20250421163507/https://epstopik.hrdkorea.or.kr/epstopik/pass/candidate/selectChart.do?lang=ko
Ministry of Employment and Labor. 2026. 국가별 일반고용허가제 외국인근로자(E-9) 도입현황 [E-9 workers admitted under the Employment Permit System, by country], 2004-2025. KOSIS. https://kosis.kr/statHtml/statHtml.do?orgId=118&tblId=DT_11827_N001&conn_path=I2
Suggested citation: Korea Immigration Regional Dashboard (KIRD). 2026. “Sri Lankan Immigrants in South Korea.” Foreign Residents in South Korea series, September 2026. Data: Korea Immigration Regional Dashboard (KIRD) dataset, https://doi.org/10.3886/E249944V1. Interactive maps and tables: https://immigrantsinkorea.today.