 Korea Immigration Regional Dashboard
SpotlightSeptember 2026Nationality profilesDownload PDF
Nepali Immigrants in South Korea
Highlights
- At the end of 2024, 74,641 Nepali nationals lived in South Korea. Nepal was the fourth-largest nationality among registered foreigners and the seventh-largest among all resident foreigners, up from ninth and twelfth in 2014.
- The Nepali population grew 74.5 percent between 2019 and 2024 (from 42,781 to 74,641), the second-fastest growth among the 20 largest nationalities.
- In 2024, 63.1 percent of Nepali residents held an E-9 non-professional employment visa, and women made up 18.1 percent of the group, compared with 45.1 percent of all resident foreigners.
South Korea had 74,641 resident foreigners of Nepali nationality on 31 December 2024, of whom 72,151 (96.7 percent) were registered foreigners, the category for foreign nationals in Korea for more than 90 days. Nepal was the fourth-largest nationality among registered foreigners (4.8 percent of the total) and the seventh-largest among all resident foreigners (2.8 percent). The count stood at 5,644 in 2006 and 26,790 in 2014, when Nepal ranked ninth among registered foreigners and twelfth among all resident foreigners.
Most Nepali nationals came through the Employment Permit System (EPS), which Nepal joined through a ministerial agreement with South Korea signed on 23 July 2007 (EPS Section Nepal, 2007). The population fell from 42,781 in 2019 to 36,903 in 2021 and then rose to 74,641 by 2024. Over the same period, the numbers holding student (D-2) and specially designated activities (E-7) visas grew several times over.
Compared with all resident foreigners, Nepali residents in 2024 were far more likely to hold employment visas (75.3 percent against 19.2 percent), much more likely to be men, and more concentrated in ages 20 to 39. They were also less concentrated in the Seoul capital area and more likely to live in rural counties. This Spotlight describes the size of the population, where Nepali residents live, their age, sex, and visa status, the channels and policies behind their migration, naturalization, health and well-being, migration from Nepal to South Korea, and community organizations.
Size of the Population over Time
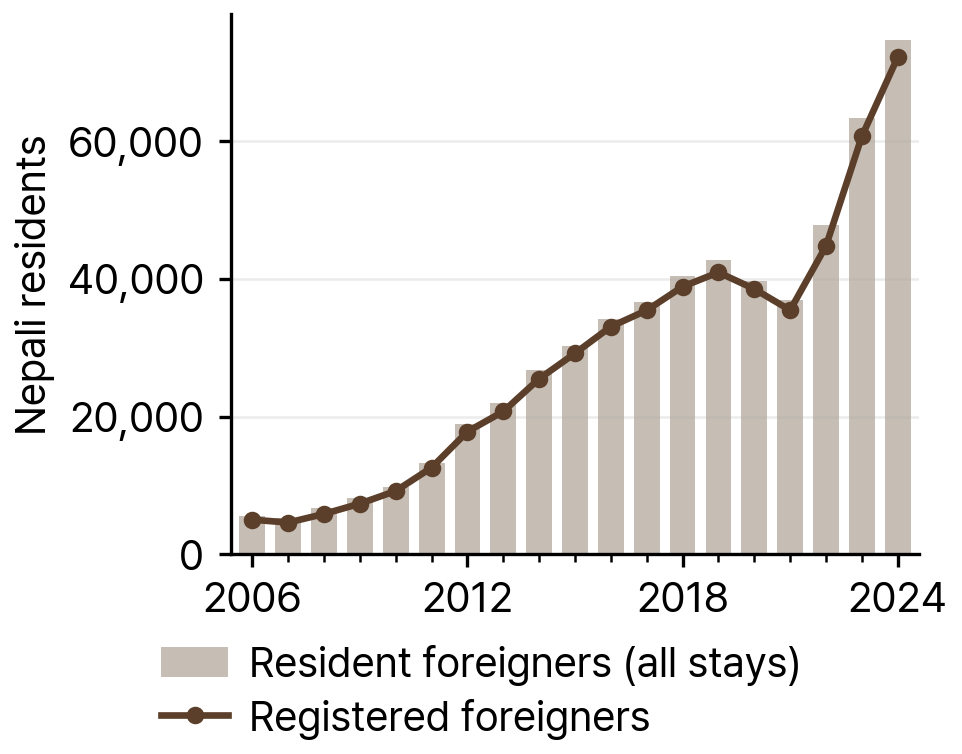
The number of Nepali resident foreigners rose from 5,644 in 2006 to 26,790 in 2014 and 42,781 in 2019 (see Figure 1). It declined to 39,743 in 2020 and 36,903 in 2021, a drop of 13.7 percent from 2019 (5,878 fewer people), then climbed to 47,865 in 2022, 63,369 in 2023, and 74,641 in 2024, the highest count on record. The 2024 total was about 13 times the 2006 total (74,641 against 5,644).
Registered foreigners made up nearly the whole group in every year: 5,039 of 5,644 in 2006 and 72,151 of 74,641 in 2024 (96.7 percent).
Nepal ranked higher among registered foreigners than among all resident foreigners in each year shown in Table 1. Among registered foreigners it ranked 16th in 2006, 9th in 2014, 7th in 2019, and 4th in 2024. Among all resident foreigners it ranked 19th, 12th, 12th, and 7th in the same years. The broader count includes short-term visitors and overseas Koreans with F-4 visas; short-term visas accounted for 1.5 percent of Nepali residents in 2024, against 19.7 percent of all resident foreigners.
Source: KIRD dataset, from Ministry of Justice immigration yearbooks, 2006-2024.
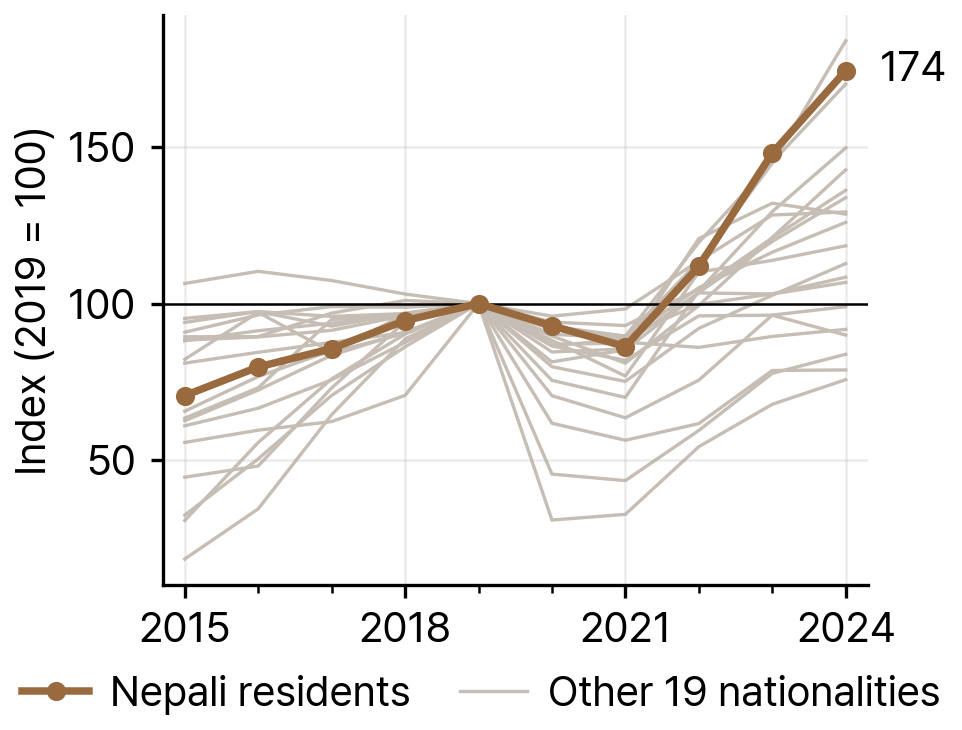
Indexed to 2019 = 100, the Nepali population stood at 174.5 in 2024, a growth of 74.5 percent over five years. That was the second-fastest growth among the 20 largest nationalities in South Korea (see Figure 2).
Source: KIRD dataset, from Ministry of Justice immigration yearbooks, 2006-2024.
Table 1Nepali Residents in South Korea, Selected Years, 2006-24
| Year | Resident foreigners | Registered foreigners | Rank among registered foreigners | Rank among all resident foreigners | Share of registered foreigners | Share of all resident foreigners |
|---|---|---|---|---|---|---|
| 2006 | 5,644 | 5,039 | 16 | 19 | 0.8% | 0.6% |
| 2014 | 26,790 | 25,493 | 9 | 12 | 2.3% | 1.5% |
| 2019 | 42,781 | 40,933 | 7 | 12 | 3.2% | 1.7% |
| 2024 | 74,641 | 72,151 | 4 | 7 | 4.8% | 2.8% |
Note: Ranks and shares are computed among all nationalities in each count. Resident foreigners include short-term visitors and F-4 overseas Koreans who report their residence; registered foreigners are long-term residents who registered with immigration authorities.
Source: KIRD dataset, from Ministry of Justice immigration yearbooks, 2006-2024.
Distribution by Province and District
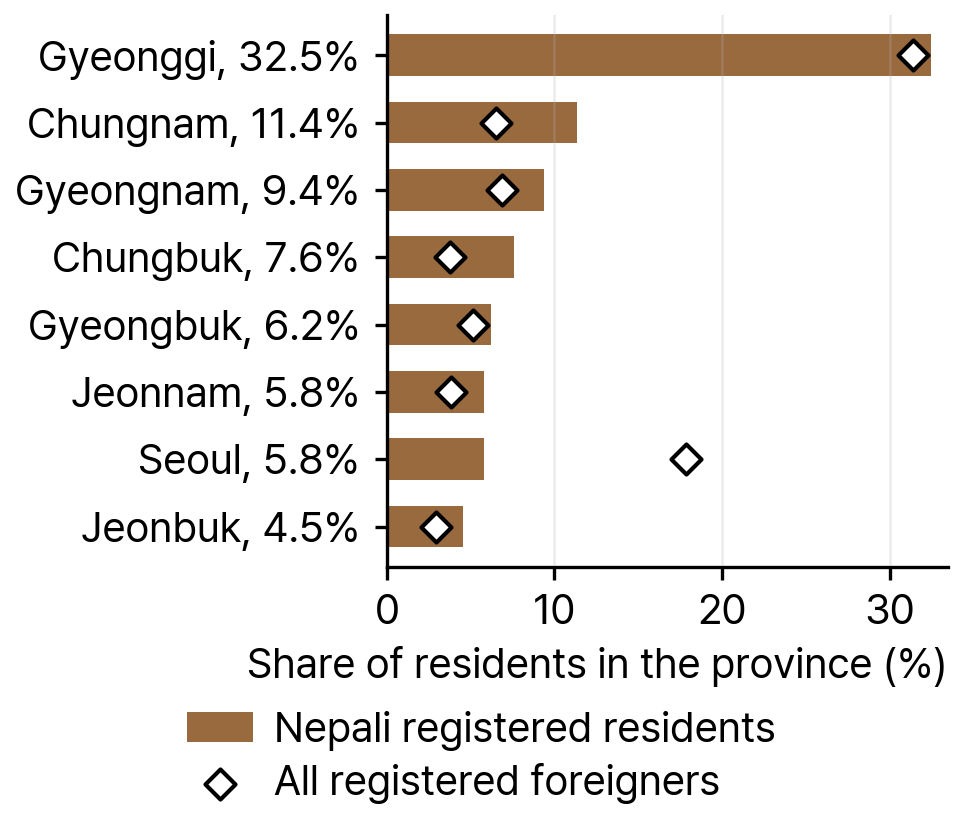
In 2024, 35.1 percent of Nepali registered residents lived in Incheon and Gyeonggi province, 22.1 percent in the Yeongnam region (Busan, Daegu, Ulsan, and the Gyeongsang provinces), 20.0 percent in the Chungcheong region, 11.1 percent in the Honam region, 5.9 percent in Gangwon and Jeju, and 5.8 percent in Seoul (see Figure 3). The Seoul capital area (Seoul, Incheon, and Gyeonggi) was home to 40.9 percent of the group, compared with 55.2 percent of all resident foreigners.
Nepali residents were more likely than other foreigners to live in rural counties (gun): 24.5 percent did in 2024, against 10.6 percent of all resident foreigners. In the Honam region, 53.1 percent of Nepali residents lived in rural counties, and in Chungcheong, 43.8 percent.
Source: KIRD dataset, from Ministry of Justice registered-foreigner statistics by district, 2024.
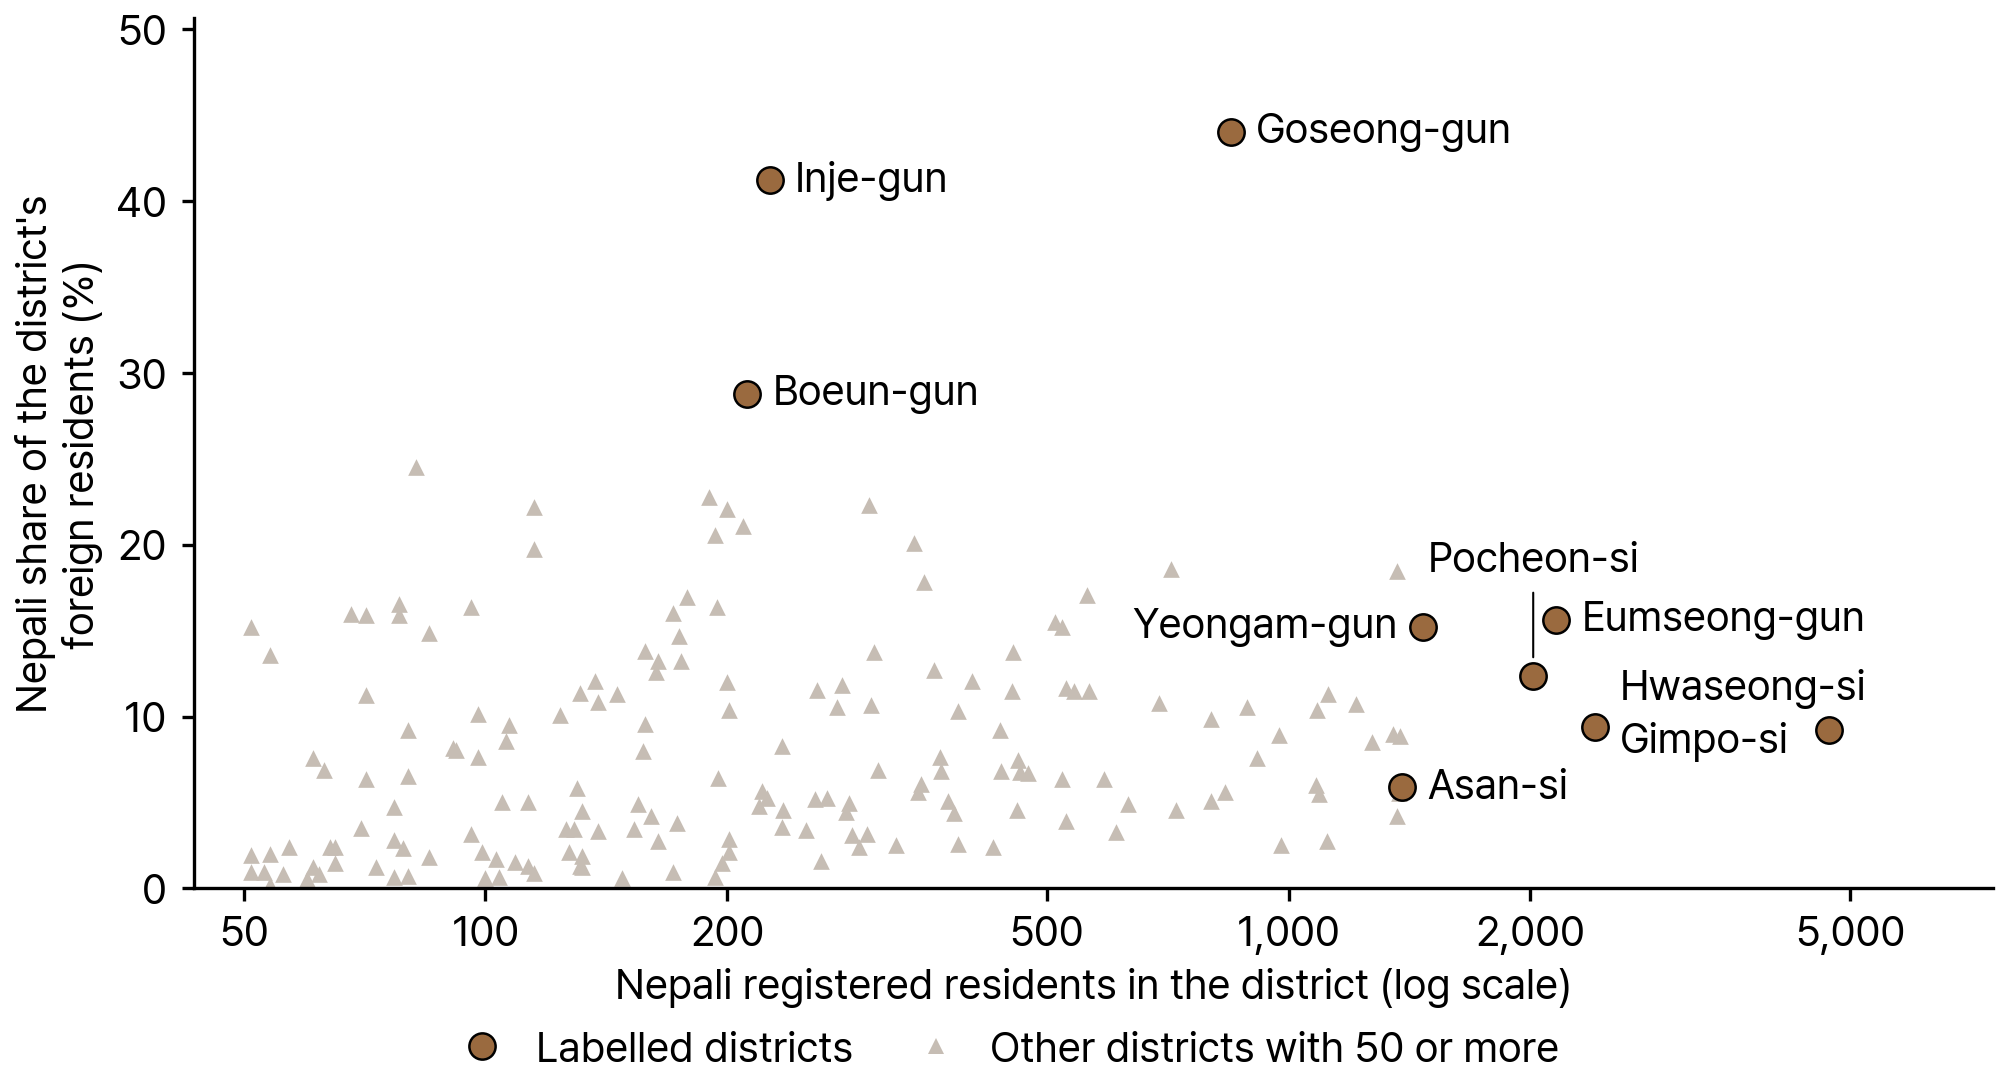
The largest Nepali populations were in Hwaseong-si (4,709), Gimpo-si (2,408), Eumseong-gun (2,156), and Pocheon-si (2,017) (see Figure 4 and Table 2). The ten largest districts together accounted for 27.2 percent of Nepali registered residents, and 140 districts had at least 100. In Seoul, the largest counts were in Jongno-gu (1,213) and Dongdaemun-gu (1,092).
Source: KIRD dataset, from Ministry of Justice registered-foreigner statistics by district, 2024.
Table 2Ten Districts with the Most Nepali Registered Residents, 2024
| District | Province | Nepali residents | Share of district's foreign residents |
|---|---|---|---|
| Hwaseong-si | Gyeonggi-do | 4,709 | 9.2% |
| Gimpo-si | Gyeonggi-do | 2,408 | 9.4% |
| Eumseong-gun | Chungcheongbuk-do | 2,156 | 15.6% |
| Pocheon-si | Gyeonggi-do | 2,017 | 12.4% |
| Yeongam-gun | Jeollanam-do | 1,471 | 15.2% |
| Asan-si | Chungcheongnam-do | 1,385 | 5.9% |
| Paju-si | Gyeonggi-do | 1,375 | 8.9% |
| Gimhae-si | Gyeongsangnam-do | 1,374 | 5.6% |
| Busan Nam-gu | Busan | 1,364 | 18.5% |
| Pyeongtaek-si | Gyeonggi-do | 1,363 | 4.2% |
Note: Share of district's foreign residents is Nepali registered residents divided by all registered foreigners in the district.
Source: KIRD dataset, from Ministry of Justice registered-foreigner statistics by district, 2024.
The index of dissimilarity (D) between Nepali residents and all other registered foreigners across districts was 0.532 in 2014 and 0.509 in 2024. At 0.509, about half of Nepali residents would have to move to another district for the group to be distributed like other foreigners.
Two districts in Gangwon province met the definition of an ethnic enclave used in this Spotlight (a location quotient of at least 2 and the group making up at least 30 percent of the district's foreign residents) in 2024. In Goseong-gun, 848 Nepali residents made up 44.0 percent of foreign residents, with a location quotient of 22.3. In Inje-gun, 226 Nepali residents made up 41.2 percent, with a location quotient of 5.1.
Age and Sex
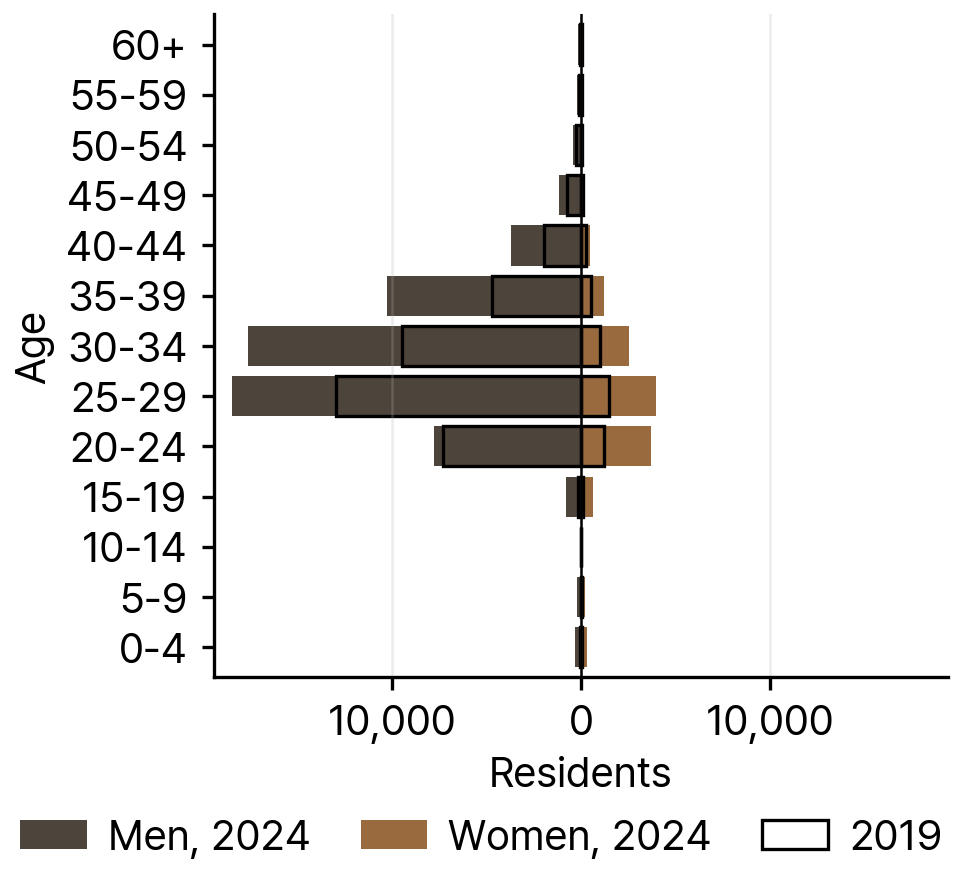
Nepali residents were concentrated in young working ages. In 2024, 87.8 percent (65,529 people) were ages 20 to 39, compared with 49.7 percent of all resident foreigners. The largest five-year age group was 25 to 29, and the median fell in the group ages 30 to 34 (see Figure 5).
Children and older adults were few. Children under age 15 made up 1.5 percent of the group in 2024 (1,136 children, up from 224 in 2019), compared with 5.7 percent of all resident foreigners. People age 60 and older made up 0.3 percent, compared with 12.9 percent of all resident foreigners.
Women made up 18.1 percent of Nepali residents in 2024 (13,494 women), up from 11.5 percent in 2019 (4,914 women). Among all resident foreigners, women made up 45.1 percent.
Source: KIRD dataset, from Ministry of Justice immigration yearbooks, 2006-2024.
Visa Status
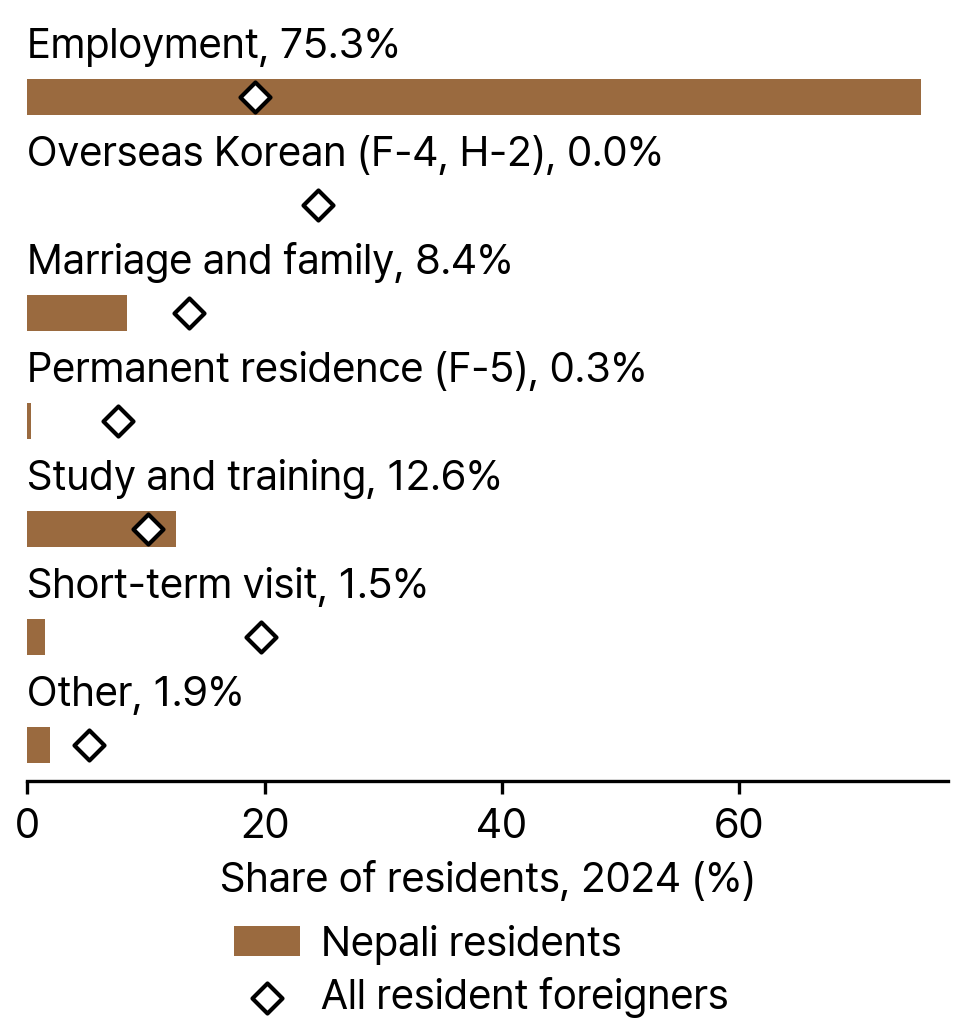
In 2024, 75.3 percent of Nepali residents held an employment visa, compared with 19.2 percent of all resident foreigners (see Figure 6). Study and training visas accounted for 12.6 percent (10.2 percent for all resident foreigners), marriage and family visas for 8.4 percent (13.6 percent), permanent residence (F-5) for 0.3 percent (7.7 percent), and short-term visits for 1.5 percent (19.7 percent).
Source: KIRD dataset, from Ministry of Justice immigration yearbooks, 2006-2024.
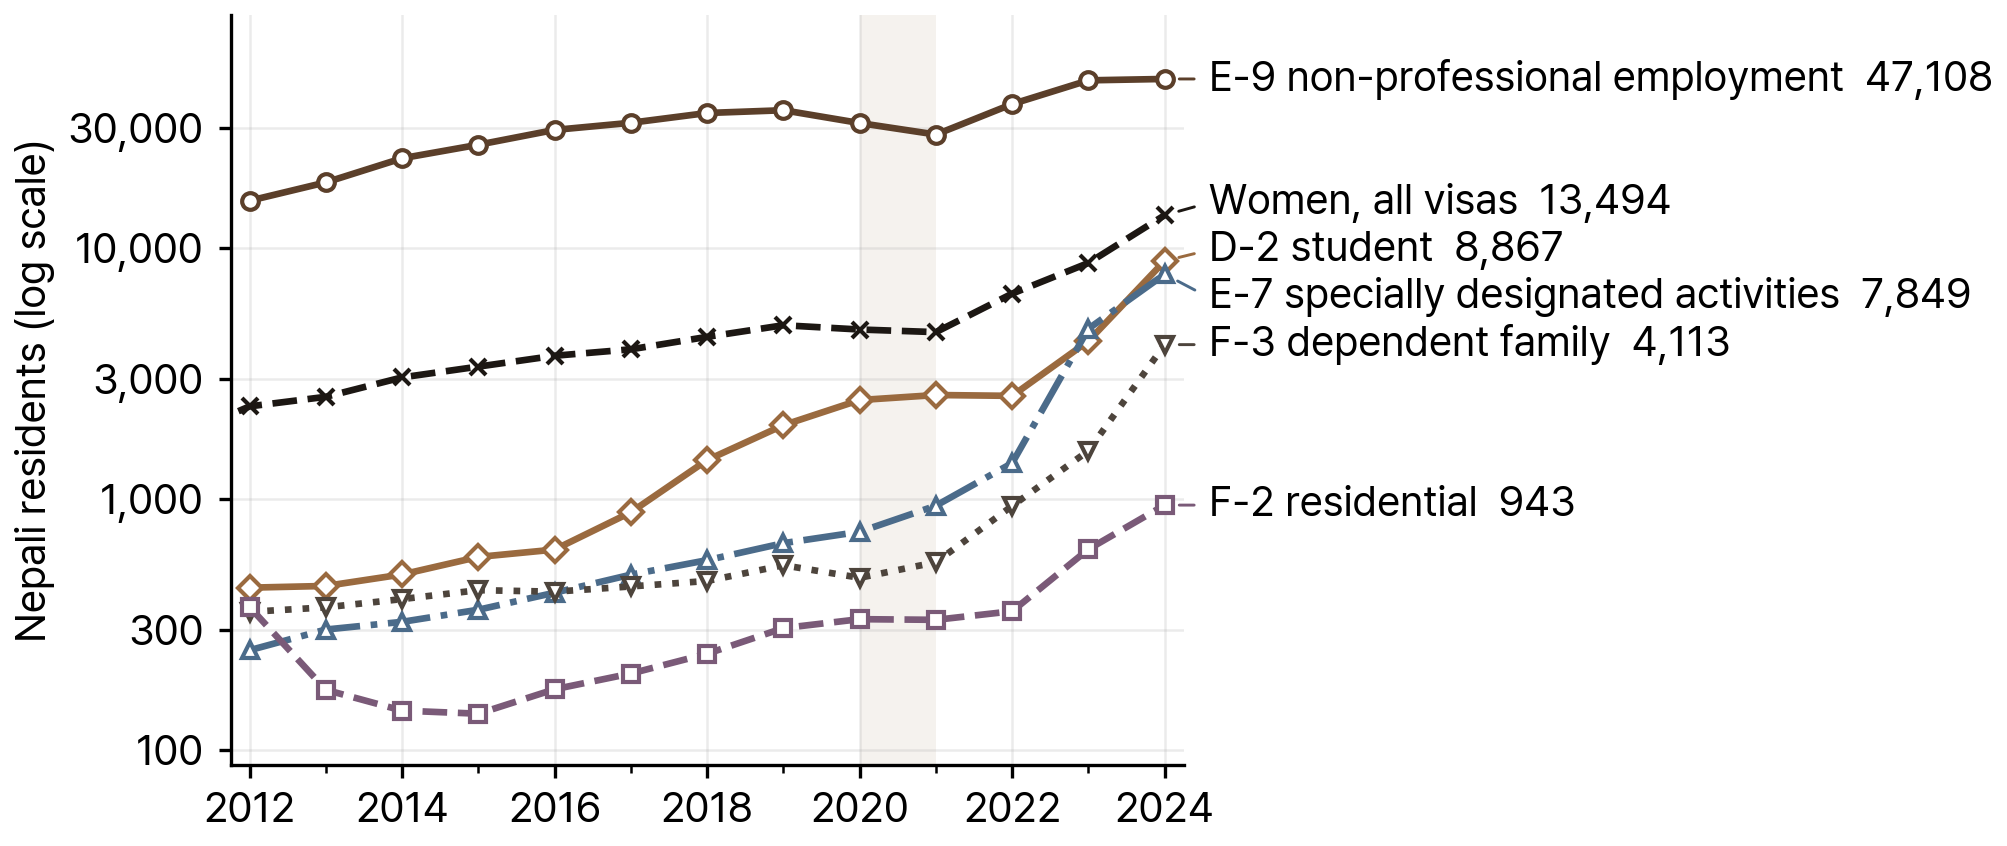
The E-9 non-professional employment visa, issued under the Employment Permit System, was held by 47,108 Nepali residents in 2024, up from 22,748 in 2014 and 35,353 in 2019. Nepali nationals made up 14.0 percent of all E-9 holders in South Korea, the second-largest share of any nationality.
Other visa types grew faster after 2019 (see Figure 7). Student (D-2) visa holders rose from 1,964 to 8,867 between 2019 and 2024, about 4.5 times. Specially designated activities (E-7) visa holders rose from 665 to 7,849, about 11.8 times, and Nepali nationals made up 12.3 percent of all E-7 holders in 2024. Dependent family (F-3) visa holders rose from 543 to 4,113. Marriage migrant (F-6) visa holders changed little, from 749 to 753.
Source: KIRD dataset, from Ministry of Justice immigration yearbooks, 2006-2024.
Table 3Nepali Residents by Visa Type, 2019 and 2024
| Visa | Meaning | 2019 | 2024 | Share of Nepali residents, 2024 | Nepali share of all holders of this visa, 2024 |
|---|---|---|---|---|---|
| E-9 | Non-professional Employment | 35,353 | 47,108 | 63.1% | 14.0% |
| D-2 | Student | 1,964 | 8,867 | 11.9% | 5.0% |
| E-7 | Specially Designated Activities | 665 | 7,849 | 10.5% | 12.3% |
| F-3 | Dependent Family | 543 | 4,113 | 5.5% | 7.8% |
| F-2 | Residential | 305 | 943 | 1.3% | 1.5% |
| C-3 | Short-term Visit | 1,000 | 850 | 1.1% | 0.5% |
| F-6 | Marriage Migration | 749 | 753 | 1.0% | 0.5% |
Note: Shares of Nepali residents are out of 74,641 resident foreigners of Nepali nationality in 2024.
Source: KIRD dataset, from Ministry of Justice immigration yearbooks, 2006-2024.
Migration Channels and Policy
Nepal and South Korea signed the ministerial-level EPS memorandum of understanding on 23 July 2007, and Nepal set up its EPS Korea Section under the Department of Foreign Employment on 26 July 2007. Two implementing agreements followed on 29 November 2007 and 10 January 2008 (EPS Section Nepal, 2007).
In a 2024 survey of Nepali workers who had returned from South Korea, 81 percent had worked in manufacturing and 18 percent in agriculture and animal husbandry (KOICA and HRD Korea, 2024).
Annual intake depends on quotas set by South Korea. For 2021, HRD Korea set Nepal's EPS quota at 5,400 workers, out of 52,000 for 16 sending countries; no Korean-language test had been held in Nepal in 2020 because of the COVID-19 pandemic (Investopaper, 2021).
Naturalization
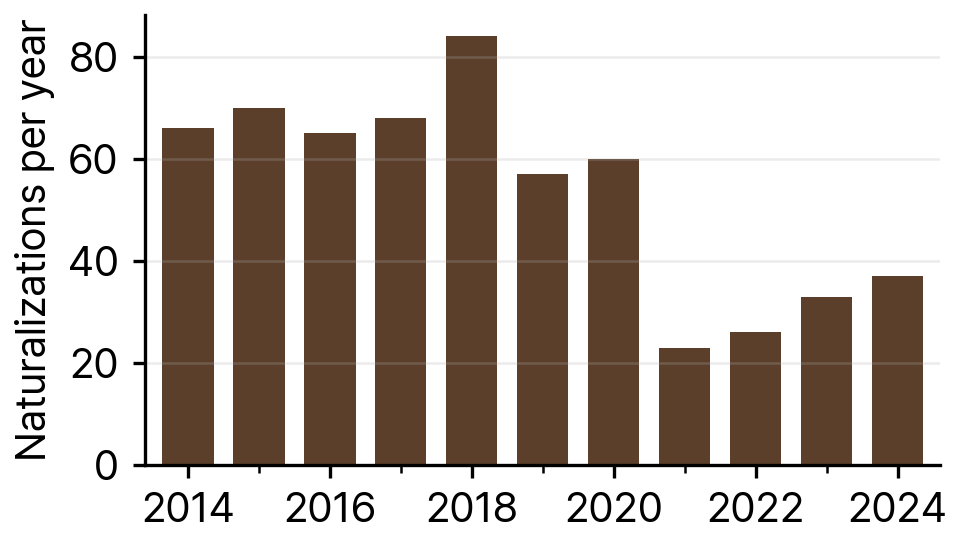
Between 2014 and 2024, 589 Nepali nationals naturalized as South Korean citizens. Annual counts ranged from 57 to 84 between 2014 and 2020, with the high of 84 in 2018, and fell to 23 in 2021 before rising to 37 in 2024 (see Figure 8). The 37 naturalizations in 2024 equal about 0.05 percent of the 74,641 Nepali residents that year.
Source: KIRD dataset, from Ministry of Justice immigration yearbooks, 2006-2024.
Unauthorized Residents
Nepal is not among the ten nationalities that the Ministry of Justice immigration yearbook (table 6-4) reports separately for unauthorized residents, so no count of unauthorized Nepali residents is published. The yearbook reported 397,522 unauthorized residents of all nationalities in 2024.
Health and Well-being
In the 2024 survey of 1,313 Nepali workers who had returned from South Korea, 18.4 percent reported an injury from an industrial accident while working there. About 44 percent of those injured had treatment paid through Workers' Compensation Insurance, and employers paid for another 44 percent (KOICA and HRD Korea, 2024).
A 2021 study reported 170 deaths of Nepali migrant workers in South Korea between 2007 and April 2019: 76 (44.7 percent) from natural causes, 47 (27.6 percent) from suicide, 45 (26.5 percent) from accidents, and 2 (1.2 percent) from homicide. In the same study, 20 Nepali migrant workers ranked family issues in Nepal, weak camaraderie at work, and hazardous, exhausting work as the main perceived risk factors for suicide (Atteraya et al., 2021).
A 2025 article cited a survey in South Korea in which 23 percent of Nepali migrants reported mental health problems and more than 66 percent reported some form of unfair treatment (Giri et al., 2025).
Migration from Nepal to South Korea
In Statistics Korea's 2023 survey of immigrants' living conditions, Nepali nationals made up 14.5 percent of the 291,000 foreign workers holding non-professional employment (EPS) visas in South Korea, the same share as Cambodians and above Vietnamese (11.9 percent) (MoLESS, 2025). To our knowledge, no published source reports South Korea's rank among the destinations of Nepali emigrants.
Nepal's Ministry of Labour, Employment and Social Security (MoLESS) reported that 19,698 Nepali workers who had passed the Korean-language test left for jobs in South Korea in fiscal year 2022/23 and 9,285 in fiscal year 2023/24 (MoLESS, 2025). From 2008 to mid-November 2022, 79,921 Nepali nationals (74,498 men and 5,423 women) went to South Korea for work under the EPS (KOICA and HRD Korea, 2024).
Registrations for the EPS Korean-language test (EPS-TOPIK) in Nepal rose from 31,525 in 2008 to 92,356 in 2019 and 164,322 in 2024 (KOICA and HRD Korea, 2024). For the 2025 recruitment round, about 103,000 Nepalis applied online for the language test against a combined quota of 5,300 places in manufacturing and in agriculture and livestock, about 19 applicants per place (Online Khabar, 2025).
Remittance inflows to Nepal totaled a record NPR 1,445 billion in 2024, equal to 25.3 percent of GDP, up from 10.7 percent of GDP in 2001 (MoLESS, 2025). The report does not break down remittances by sending country. The World Bank's bilateral remittance estimates, last produced for 2021, put remittances sent from South Korea to Nepal at about US$136.8 million that year (World Bank, 2021).
Koshi Province sends the largest share of Korea-bound workers. Department of Foreign Employment data reported in December 2025 put Koshi's share of Nepalis who had gone to South Korea for work at 33.2 percent (Nepal News, 2025). Of 20,000 workers who returned from South Korea between 2018 and 2022, 5,638 (28.2 percent) came from Koshi, 4,963 from Gandaki, 4,170 from Bagmati, and 3,294 from Lumbini. Sudurpashchim (1,004), Madhesh (474), and Karnali (457) supplied the fewest (KOICA and HRD Korea, 2024).
Nepal sends workers to South Korea under a government-to-government (G2G) arrangement, without private recruitment agencies. According to the Nepal Labour Migration Report 2024, Nepal issued G2G labor approvals for South Korea, Israel, and the United Kingdom; the arrangement with the United Kingdom, for nurses, began in 2022 (MoLESS, 2025).
In September 2023, Nepal's Ministry of Labour, Employment and Social Security stated that no agreement existed with South Korea on seasonal workers, after a false notice claiming a deal to recruit 12,000 Nepali workers circulated on social media; the ministry said the EPS agreement was the only one being implemented (Kathmandu Post, 2023a).
In December 2023, two protesters died in clashes over a rule that barred applicants on the shipbuilding track from taking the Korean-language test for manufacturing jobs. Nepal's High Court ordered the government to allow those applicants to apply for manufacturing jobs, and Nepal's EPS office issued a notice opening the manufacturing test after South Korea said it could consider the request (Kathmandu Post, 2023b).
Table 4Migration Indicators, Nepal and South Korea
| Indicator | Value | Source |
|---|---|---|
| Nepali share of EPS (non-professional employment) workers in South Korea, 2023 | 14.5% of 291,000 | MoLESS, 2025 |
| EPS departures to South Korea, fiscal year 2022/23 | 19,698 | MoLESS, 2025 |
| EPS departures to South Korea, fiscal year 2023/24 | 9,285 | MoLESS, 2025 |
| Cumulative EPS departures to South Korea, 2008 to mid-November 2022 | 79,921 | KOICA and HRD Korea, 2024 |
| EPS-TOPIK registrants in Nepal, 2024 | 164,322 | KOICA and HRD Korea, 2024 |
| EPS-TOPIK applicants and quota places, 2025 round | 103,000 applicants for 5,300 places | Online Khabar, 2025 |
| Remittance inflows to Nepal, 2024 | NPR 1,445 billion | MoLESS, 2025 |
| Remittances as a share of Nepal's GDP, 2024 | 25.3% | MoLESS, 2025 |
| Remittances from South Korea to Nepal, 2021 (World Bank estimate) | US$136.8 million | World Bank, 2021 |
| Share of Korea-bound EPS workers from Koshi Province, reported in 2025 | 33.2% | Nepal News, 2025 |
Note: Nepal's fiscal year 2022/23 ended in mid-2023 and fiscal year 2023/24 in mid-2024.
Source: Sources as listed in each row.
Studies of Nepali migrants in South Korea have examined work, family life, and health. Seo (2019) found that EPS workers treated the fixed term of their permits as a "liminal time" or "time-out" from the life course, a view that made precarious work bearable. Nguyen et al. (2024) interviewed 18 Nepali migrant fathers in South Korea and 11 mothers in Nepal; fathers reported guilt over their distance from their children and felt respected by their communities, and mothers reported loneliness and added caregiving stress and felt heavily scrutinized. Atteraya et al. (2021) identified eight perceived risk factors for suicide among 20 Nepali workers (see Health and Well-being). Baniya et al. (2023) surveyed 402 students at Korean-language institutes in the Kathmandu Valley in 2019. Their spending before migration ranged from NPR 20,000 to more than NPR 200,000, and 39 percent spent NPR 50,000 to 100,000; 80.8 percent relied on family support, 7.0 percent borrowed, and 85 percent of those who borrowed paid interest of 12 to 36 percent a year. The costs include no recruitment-agency fees, because the two governments run the EPS without private agencies.
Community Organizations
Changsin-dong in Seoul's Jongno District is the main gathering place of the Nepali community in Korea. A 2026 report estimated about 500 Nepali students in the wider area, about 200 longer-term Nepali residents in Changsin-dong itself, and more than 18 Nepali restaurants (Korea JoongAng Daily, 2026).
The South Korea chapter of the Non-Resident Nepali Association (NRNA Korea) has more than 100 members, and about 60 Nepali organizations operate across the country (Korea Times, 2026).
Of the 1,720 migrant-serving organizations in the KIRD census, 9 name Nepali people in their name or target group. They include Nepal House (Jongno-gu, Seoul), the Nepal Cultural Center (5S) and Library (Danwon-gu, Ansan), the Pyeongtaek Foreign Workers Healing Center (Pyeongtaek-si), Cheonan Moise (Dongnam-gu, Cheonan), the Universal Cultural Center (Dong-gu, Gwangju), Hapdeok Foreigners' Church (Dangjin-si), and Sri Radha Shyamasundar Mandir, the ISKCON Seoul temple (Yongsan-gu, Seoul). Most general-purpose organizations in the census, such as multicultural family and foreign worker support centers, also serve Nepali residents.
Sources
KIRD dataset (Korea Immigration Regional Dashboard), openICPSR. https://doi.org/10.3886/E249944V1
EPS Section Nepal, Department of Foreign Employment, Government of Nepal. About Us. https://epsnepal.gov.np/page/about-us
Korea International Cooperation Agency (KOICA) and Human Resources Development Service of Korea (HRD Korea). 2024. First Survey of Nepali Migrants' Experiences in South Korea and Entrepreneurship and Employment after Returning Home. https://ceslam.org/wp-content/uploads/2024/11/nepali-migrants-experiences-in-south-korea.pdf
Investopaper. 2021. South Korea Sets 5,400 Quota for Nepalis under EPS. https://www.investopaper.com/news/eps-quota-for-nepalis/
Kathmandu Post. 2023a. Labour Ministry Says No Deal Reached on Sending Seasonal Workers to South Korea. 8 September 2023. https://kathmandupost.com/national/2023/09/08/labour-ministry-says-no-deal-reached-on-sending-seasonal-workers-to-south-korea
Kathmandu Post. 2023b. Korea Hints It May Help Resolve the EPS Controversy in Nepal. 31 December 2023. https://kathmandupost.com/national/2023/12/31/korea-hints-it-may-help-resolve-the-eps-controversy-in-nepal
Giri, Bibek, Minani Gurung, Qorinah Estiningtyas Sakilah Adnani, and Vijay Kumar Chattu. 2025. Mental Health of Nepalese Migrant Workers: A Call for Action in South Korea. JNMA: Journal of the Nepal Medical Association 63 (288). https://pmc.ncbi.nlm.nih.gov/articles/PMC12827870
Korea JoongAng Daily. 2026. In Seoul's Changsin-dong, Nepalis Built a Neighborhood That Still Feels Like Home. https://www.koreajoongangdaily.com/lifestyle/in-seouls-changsindong-nepalis-built-a-neighborhood-that-still-feels-like-home/12784962
Korea Times. 2026. Nepalis in Korea Mobilize to Support Flood-Stricken Homeland as Tourism Industry Faces Fallout. https://www.koreatimes.co.kr/southkorea/society/20260902/nepalis-in-korea-mobilize-to-support-flood-stricken-homeland-as-tourism-industry-faces-fallout
Government of Nepal, Ministry of Labour, Employment and Social Security (MoLESS). 2025. Nepal Labour Migration Report 2024. https://giwmscdnone.gov.np/media/pdf_upload/Nepal%20Labour%20Migration%202024_Final-Version%20for%20Approval%20%281%29_peesvxa.pdf
Online Khabar. 2025. Over 103,000 Nepalis Apply for 5,300 EPS Jobs in Korea. https://english.onlinekhabar.com/103000-nepalis-apply-eps.html
Nepal News. 2025. Labor Destinations of Nepalis Have Changed but Government Policies Remain the Same. https://english.nepalnews.com/s/business/labor-destinations-of-nepalis-have-changed-but-government-policies-remain-the-same/
Atteraya, M. S., Ebrahim, N. B., & Gnawali, S. (2021). Perceived risk factors for suicide among Nepalese migrant workers in South Korea. International Journal of Environmental Research and Public Health, 18(12), 6368. https://doi.org/10.3390/ijerph18126368
Nguyen, M. H., Kim, Y., Choi, Y., Jang, J. H., Shakya, M., Adhikari, A., Luitel, N. P., & Surkan, P. J. (2024). Guardians looking from outside: Gendered experiences of labor migration and psychosocial health among Nepalese migrant fathers and left-behind mothers. Qualitative Health Research, 35(6), 665–679. https://doi.org/10.1177/10497323241265291
Seo, S. (2019). Temporalities of class in Nepalese labour migration to South Korea. Current Sociology, 67(2), 186–205. https://doi.org/10.1177/0011392118792925
World Bank. 2021. Bilateral Remittance Estimates (WB_KNOMAD_BRE), Data360. https://data360api.worldbank.org/data360/data?DATABASE_ID=WB_KNOMAD&INDICATOR=WB_KNOMAD_BRE&REF_AREA=KOR
Baniya, J., Bhattarai, S., Kharel, A., Rai, N., & Tumsa, D. (2023). 'Only a few can afford to go to Korea': The costs of Nepali migration to South Korea (CESLAM Research Paper XIV). Centre for the Study of Labour and Mobility, Social Science Baha. https://ceslam.org/wp-content/uploads/2024/11/eps-south-korea-research-paper-xiv.pdf
Suggested citation: Korea Immigration Regional Dashboard (KIRD). 2026. “Nepali Immigrants in South Korea.” Foreign Residents in South Korea series, September 2026. Data: Korea Immigration Regional Dashboard (KIRD) dataset, https://doi.org/10.3886/E249944V1. Interactive maps and tables: https://immigrantsinkorea.today.